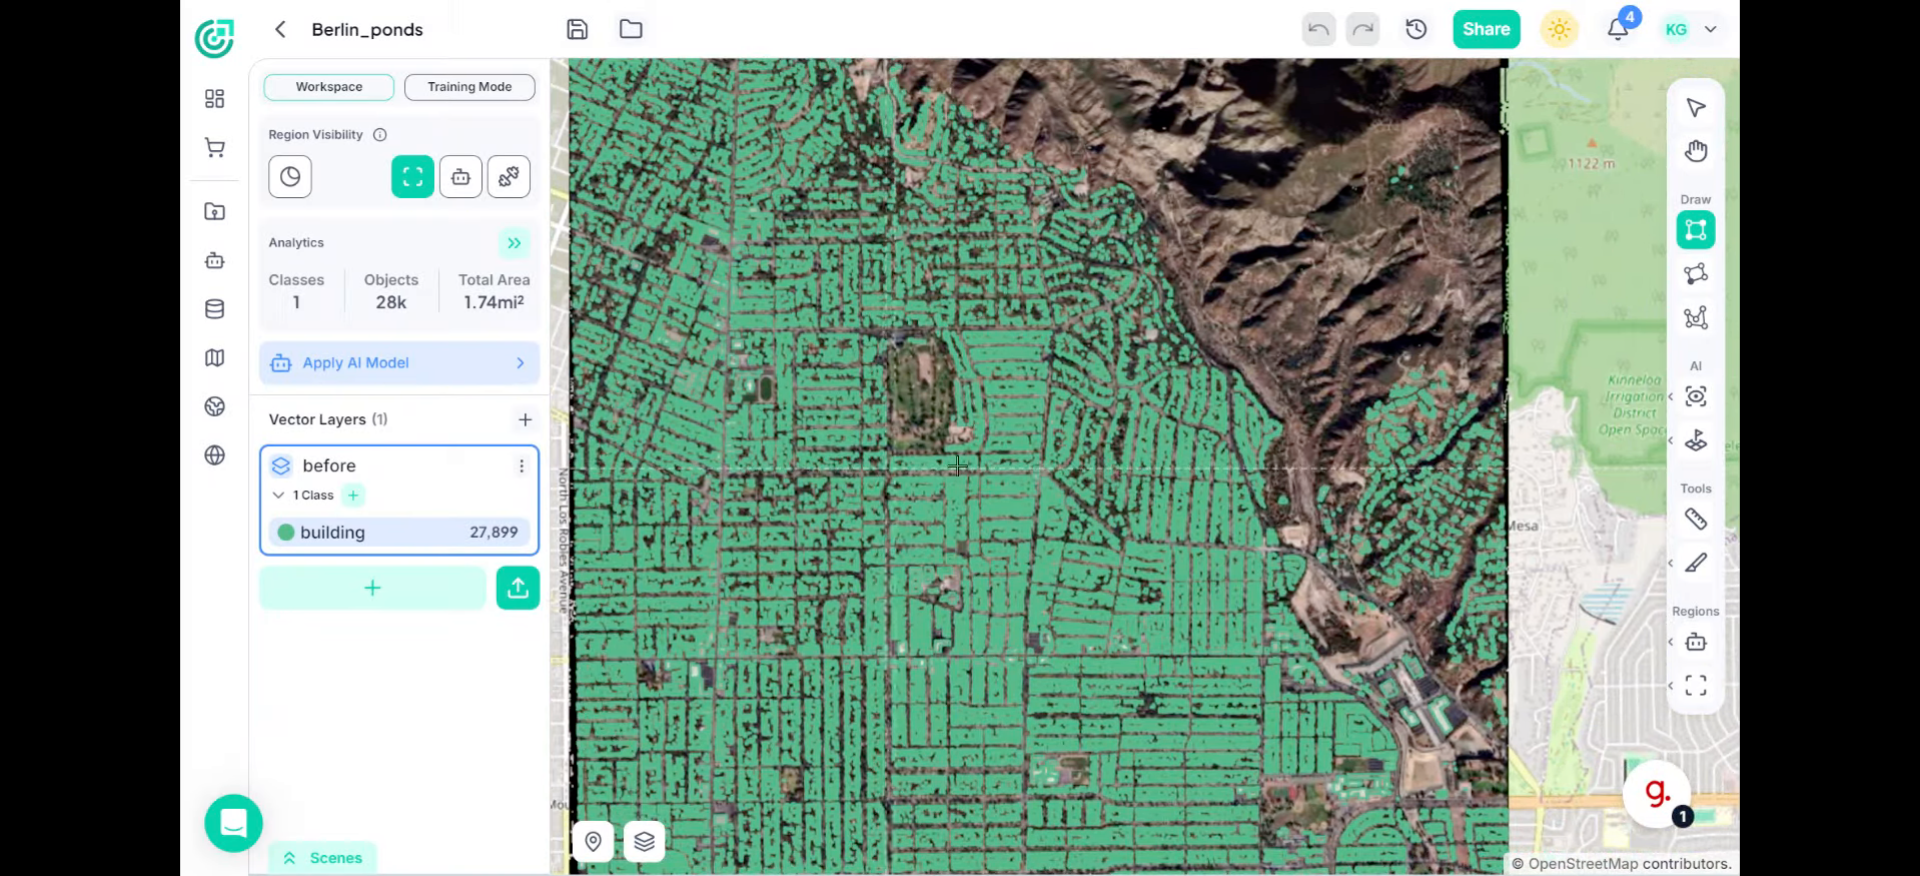
Work with Time Series and Change Analysis
This demo shows how to use FlyPix AI to analyze geospatial imagery over time and detect changes between satellite scenes.
Go to app.flypix.ai
1. Introduction
In this guide, you'll learn how to navigate the FlyPix workspace, compare scenes captured at different times, and analyze detected changes using the Time Series tools.
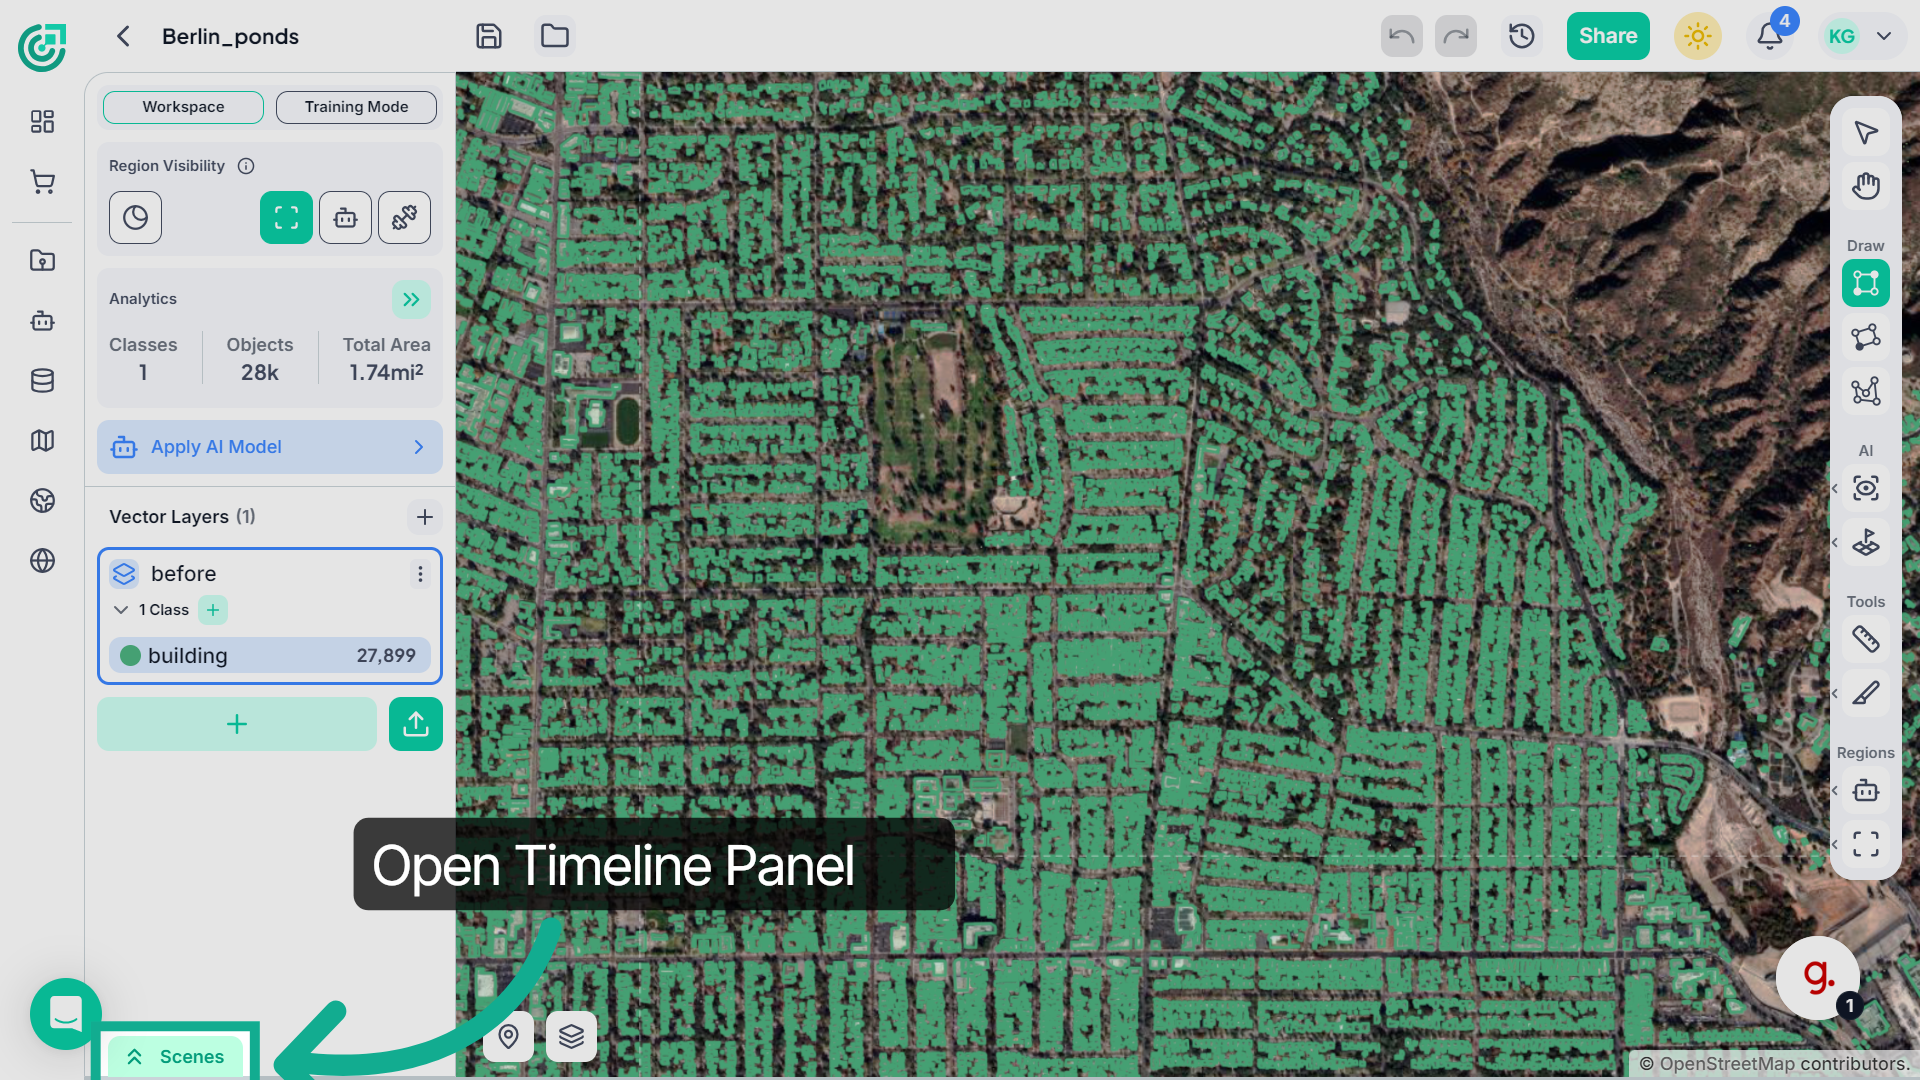
2. Open Timeline Panel
First, look at the Timeline panel located at the bottom of the workspace. This section allows you to manage the scenes used for time series analysis.
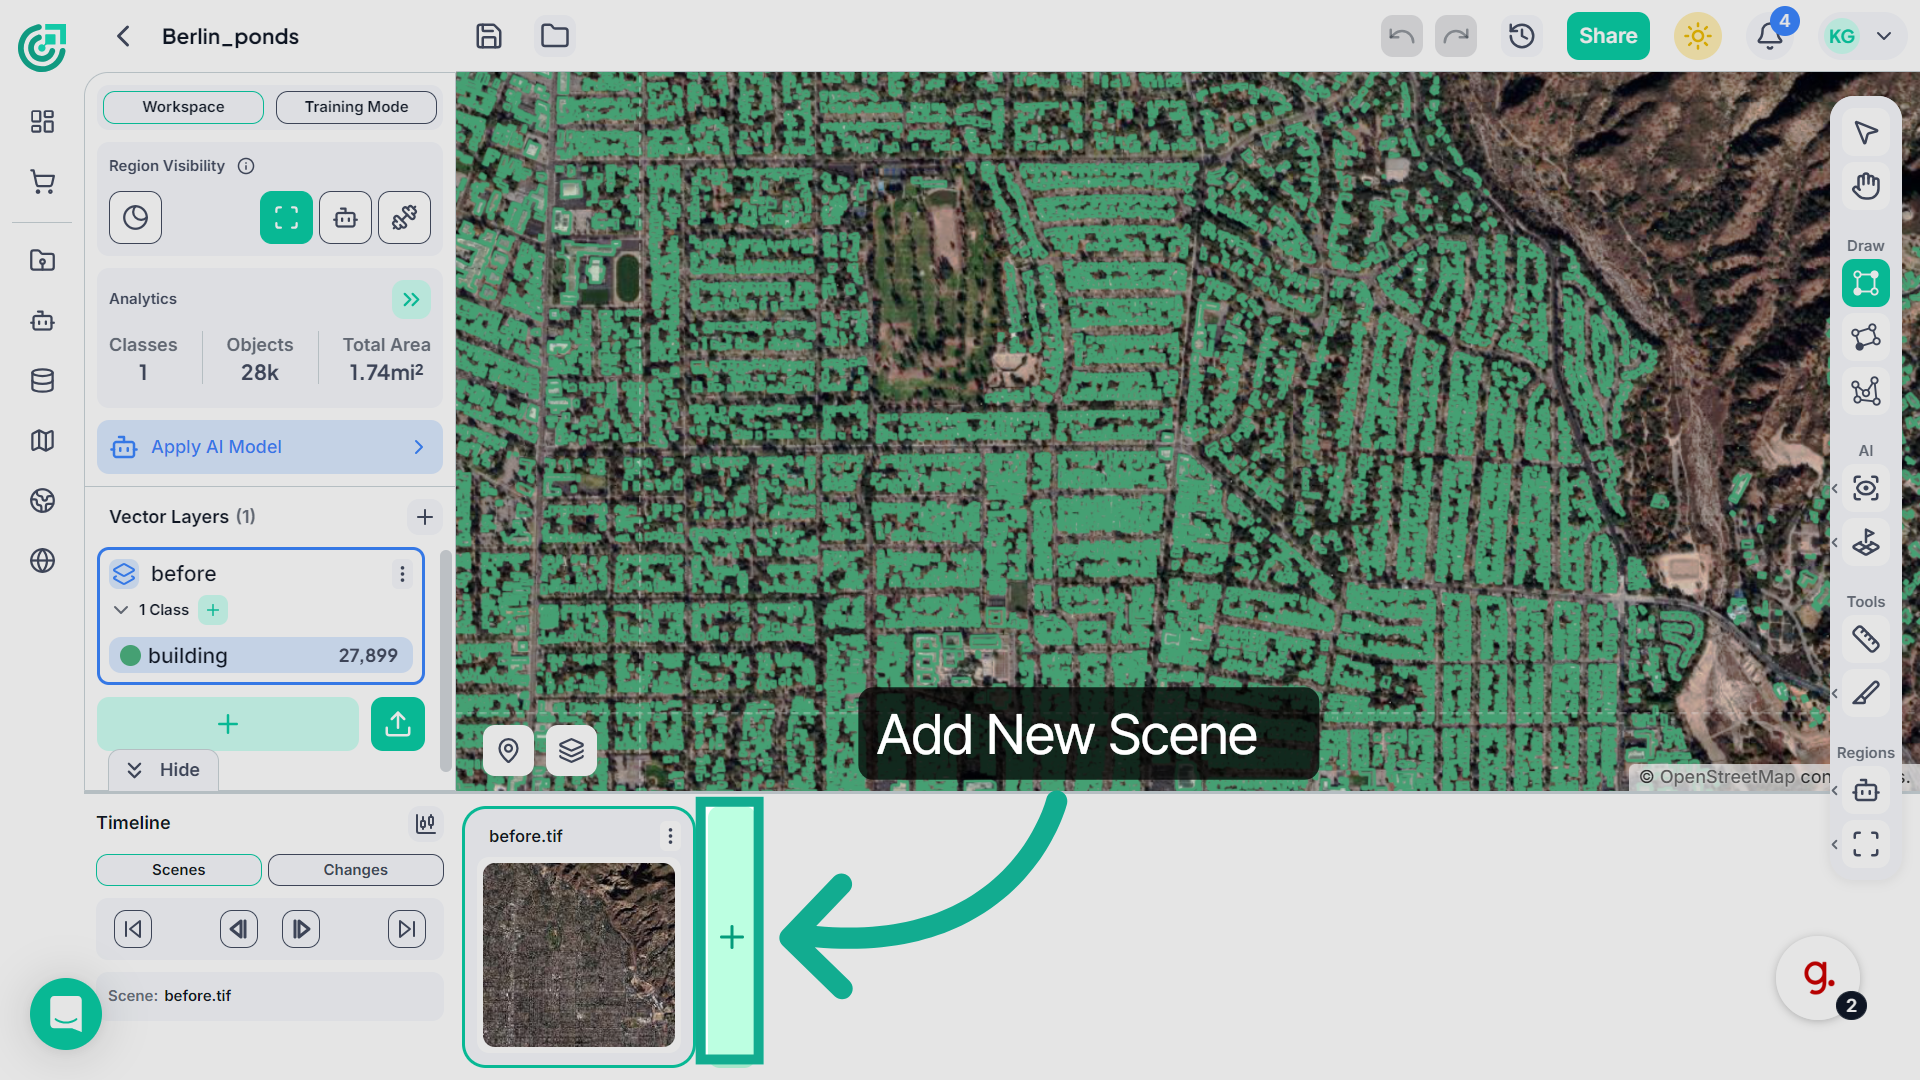
3. Add Scenes for Comparison
To perform change detection, you can compare two different scenes captured at different times, or use the same scene multiple times if needed. Click the plus icon to add another scene.
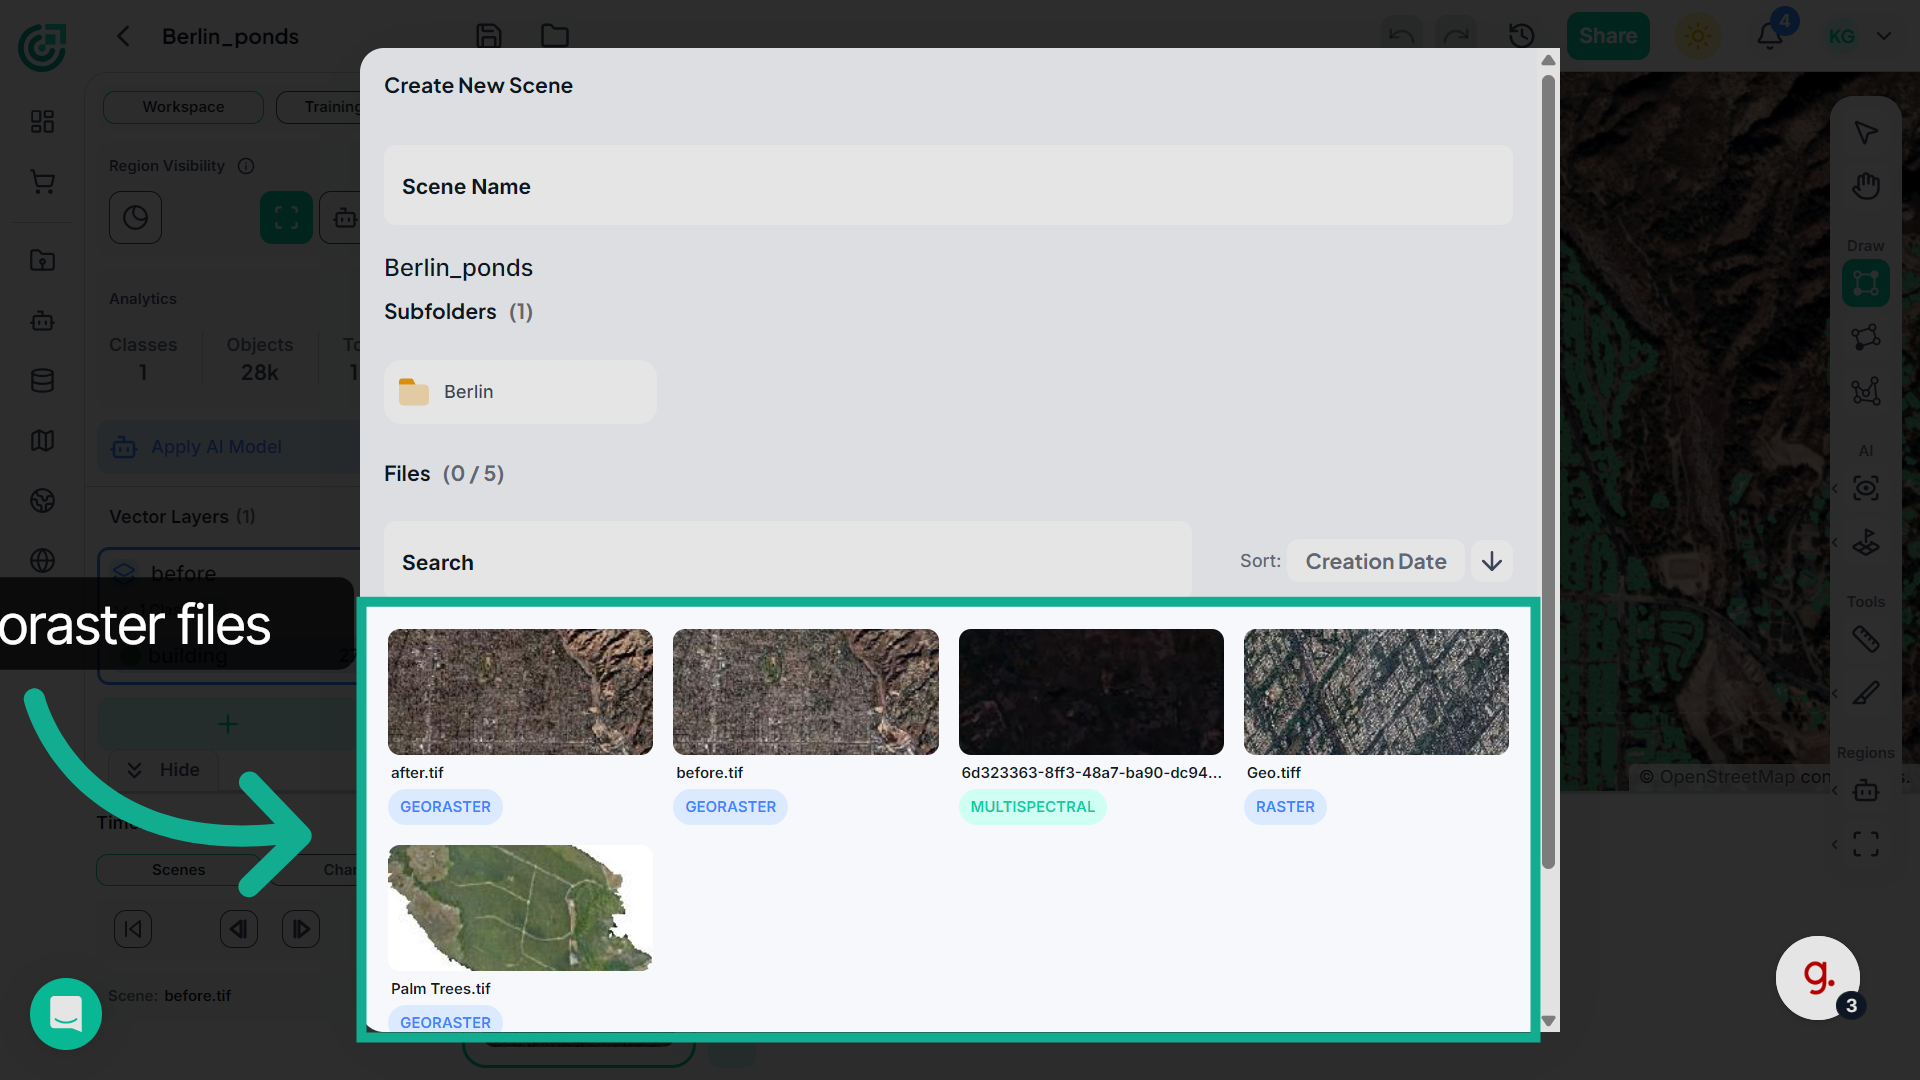
4. Select Georaster Files
For comparison, select the same location file that represents different time periods, such as an image showing earlier or later changes
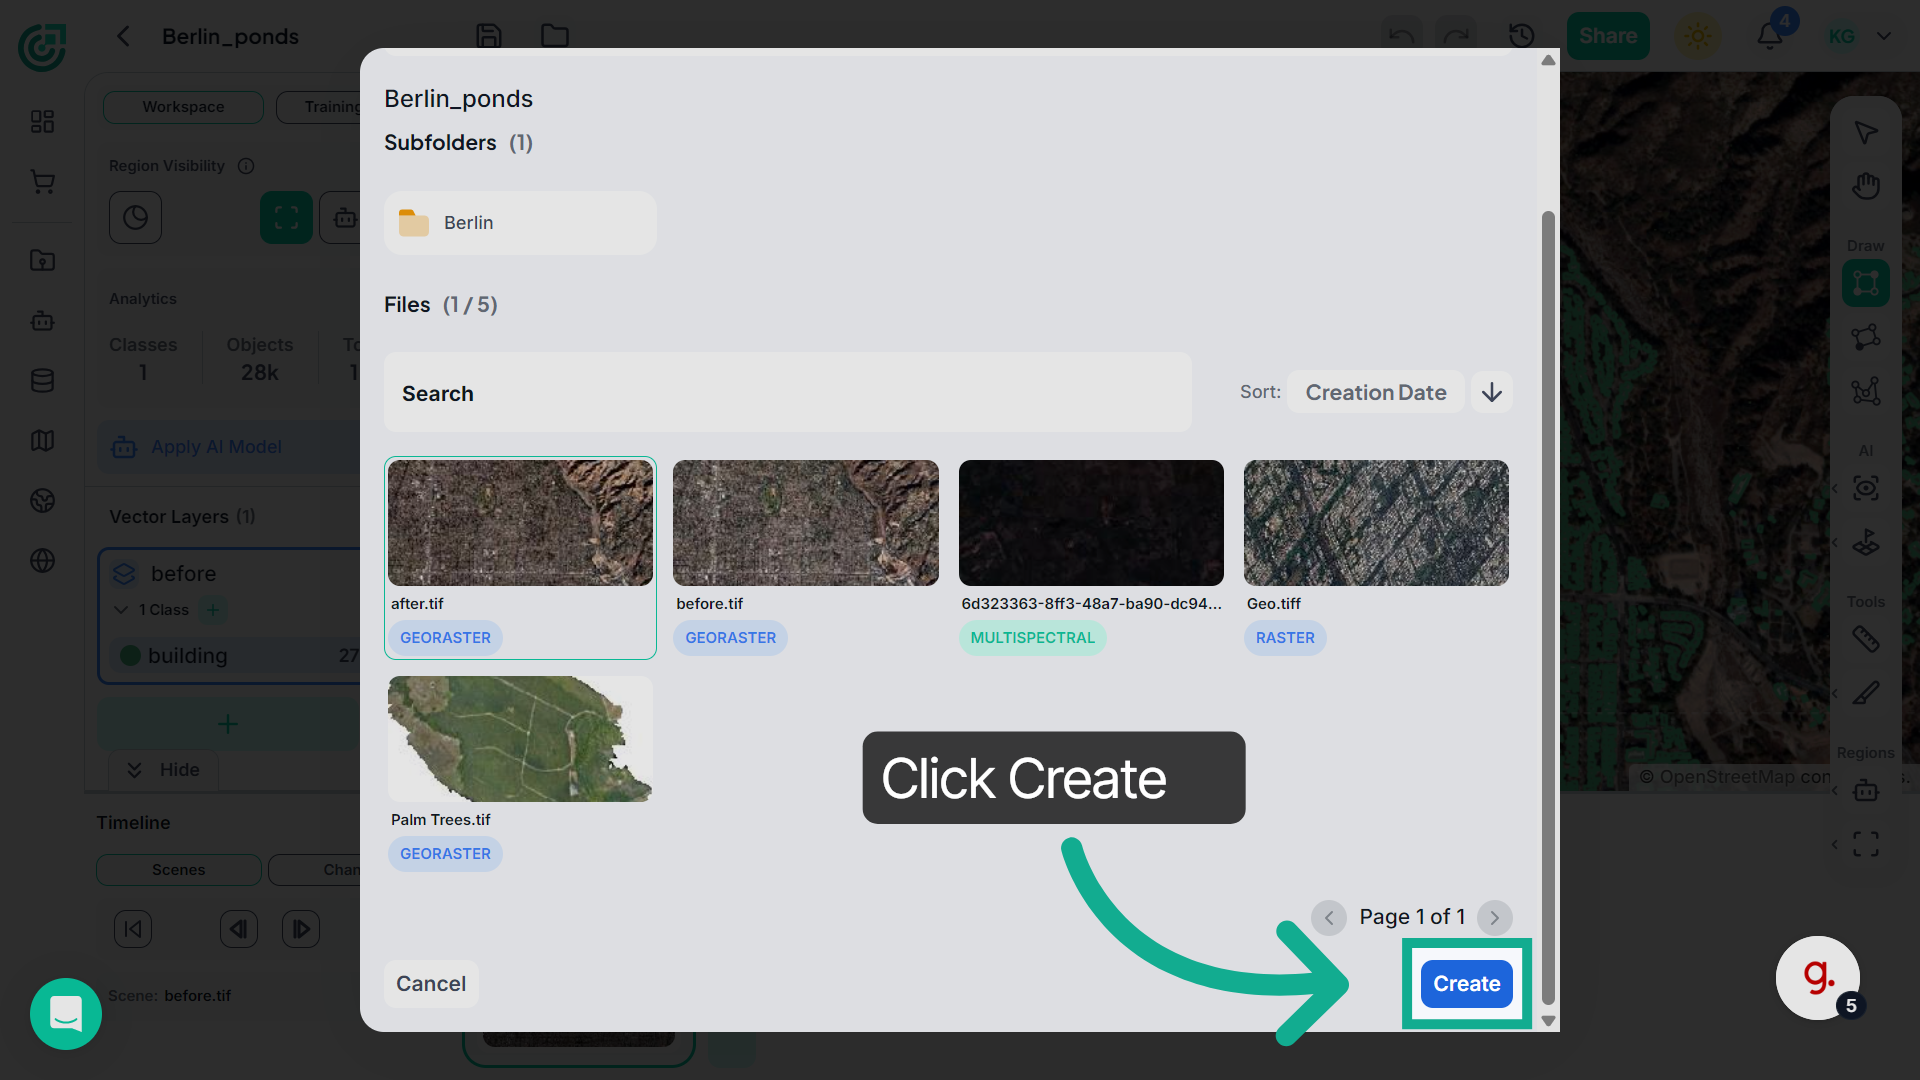
5. Create New Analysis
Click Create to add the selected scene to the Timeline, allowing you to compare it with other scenes for change detection.
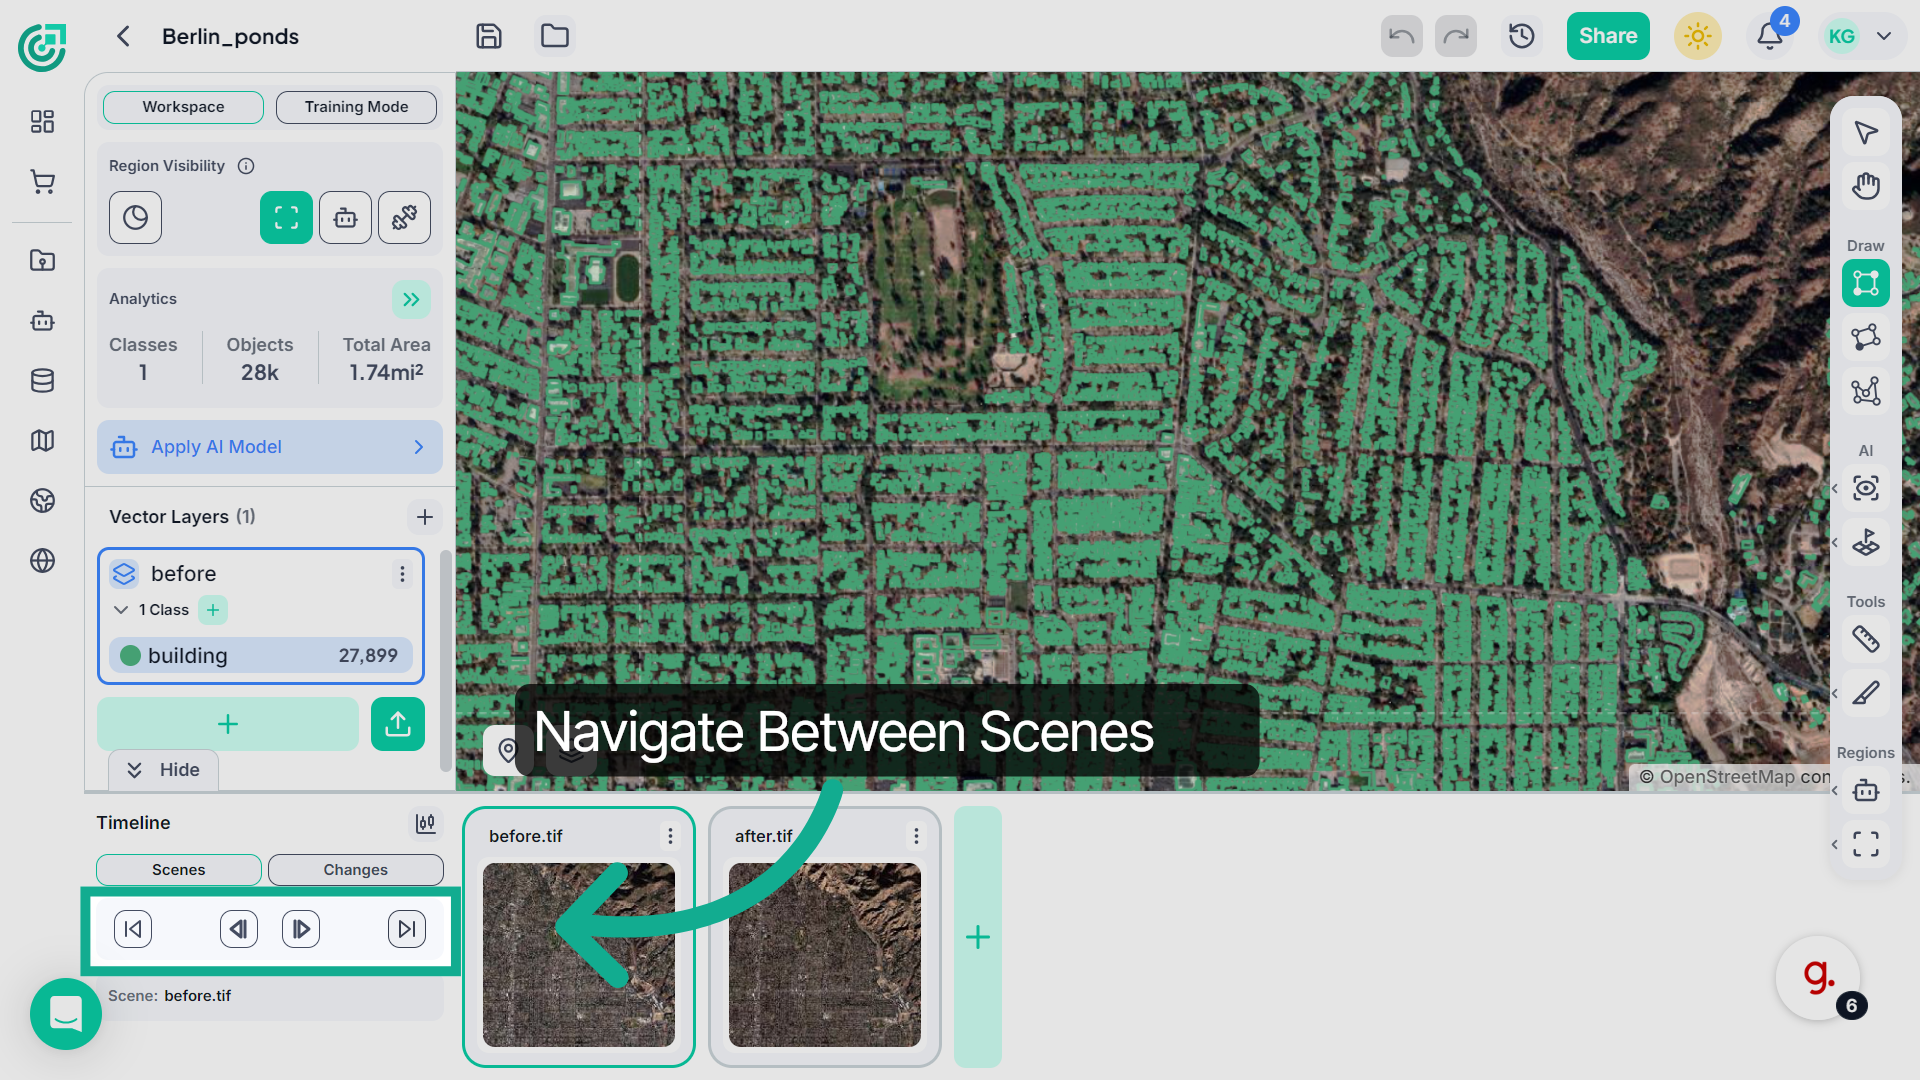
6. Access Additional Options
Use these timeline controls to navigate between the available scenes. You can move to the previous or next scene, or quickly jump to the first or last scene in the timeline to review the imagery across different time periods.
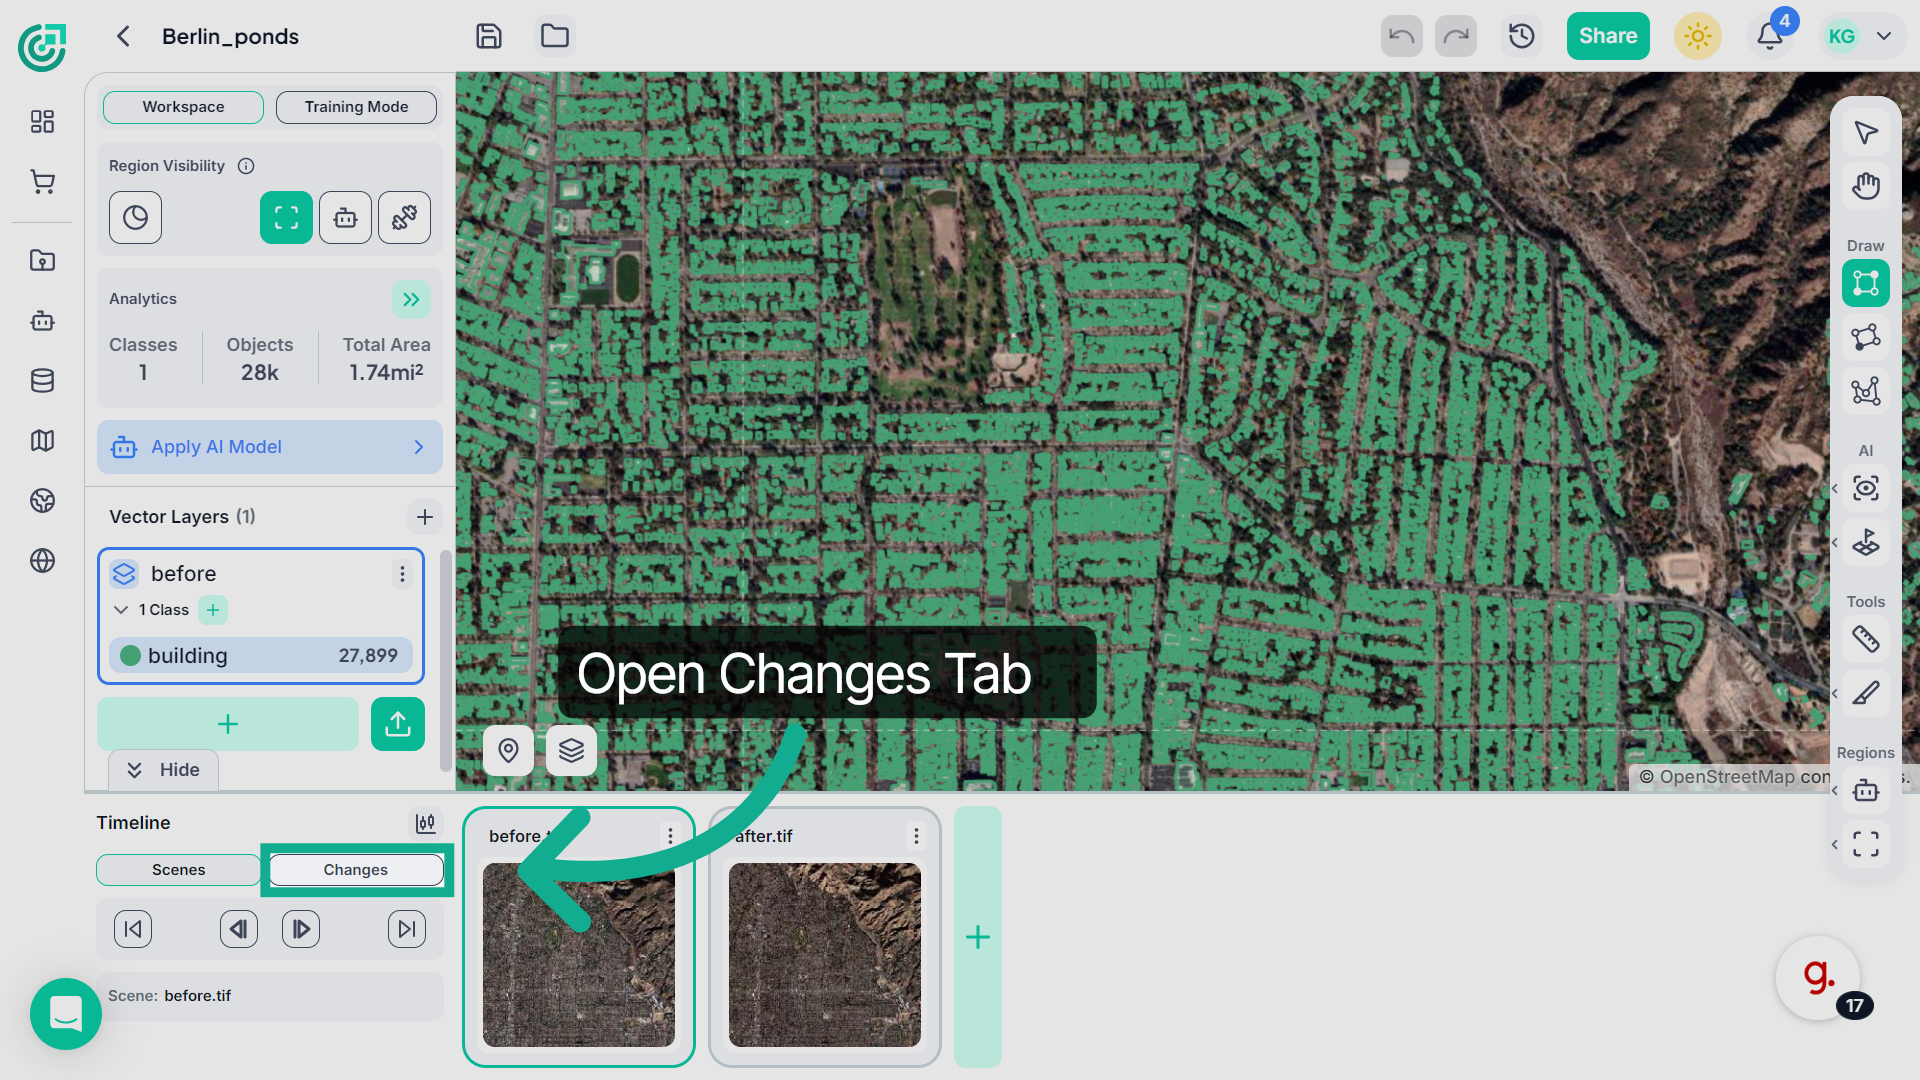
7. View Changes Section
Now switch to the Changes tab in the timeline to begin analyzing differences between the selected scenes.
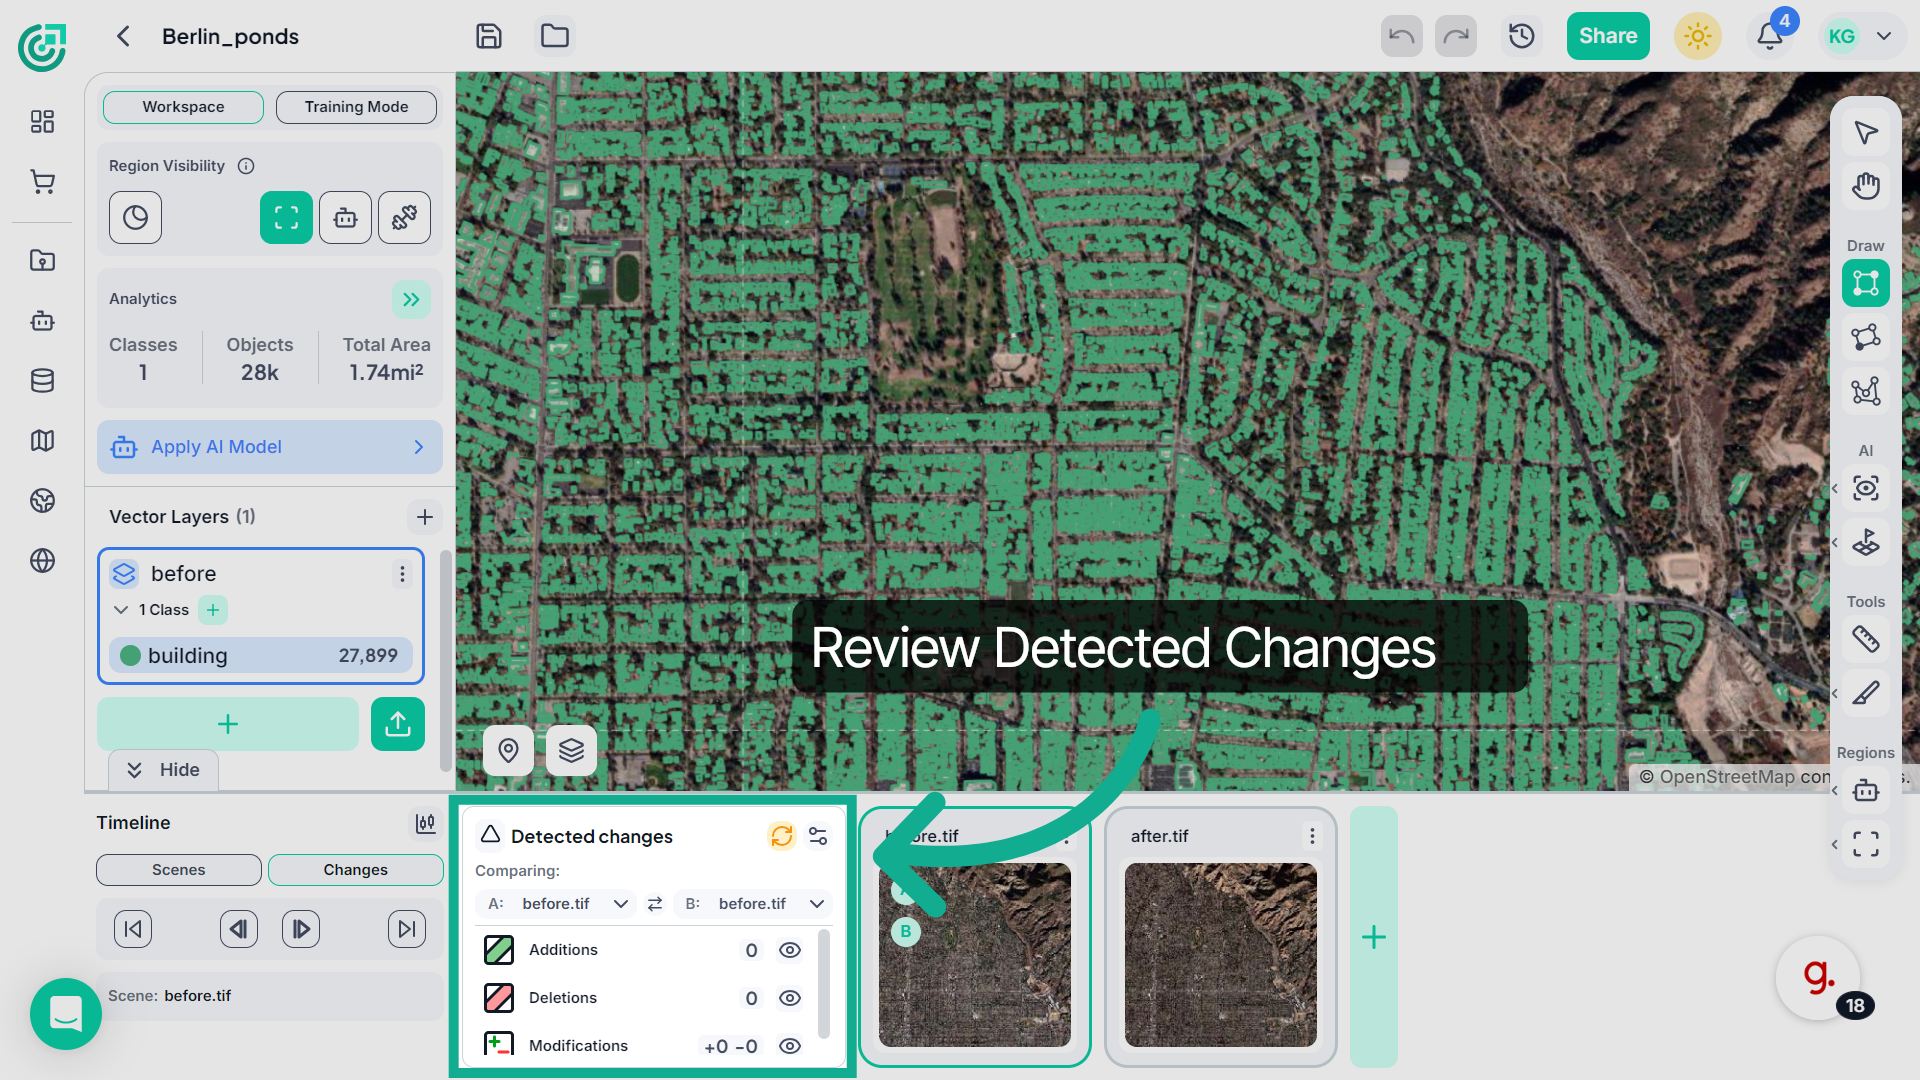
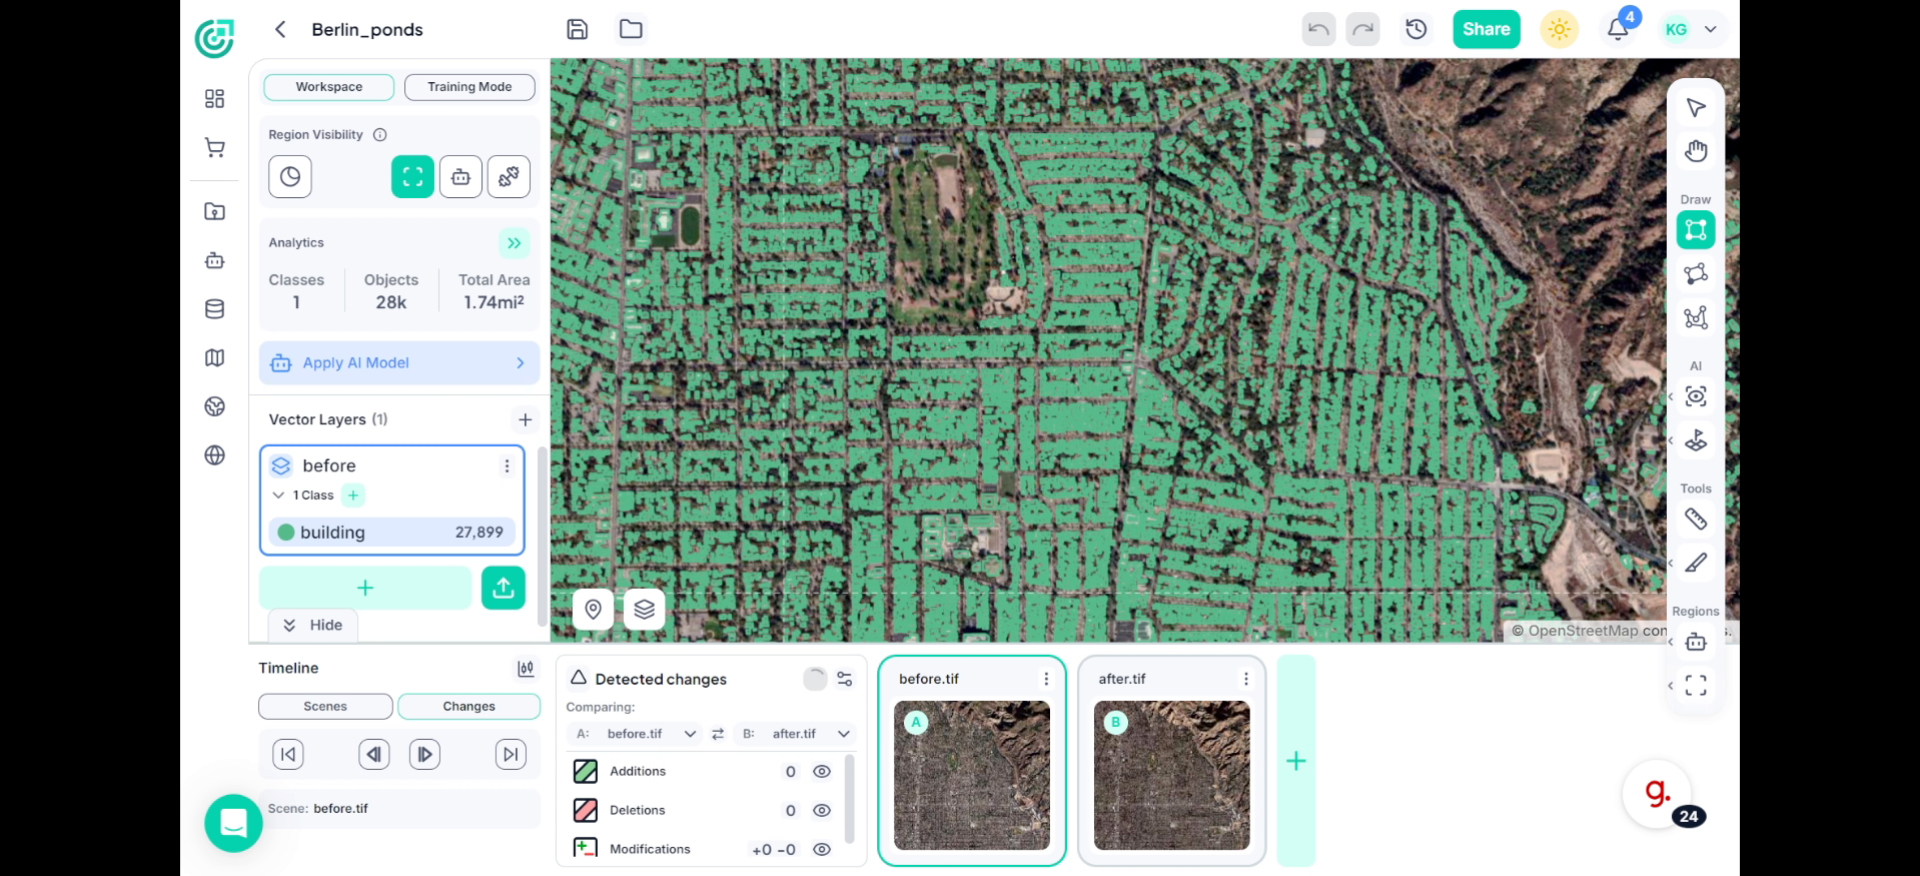
8. Review Detected Changes
Inside the Detected Changes panel, you can analyze changes within the selected scene.
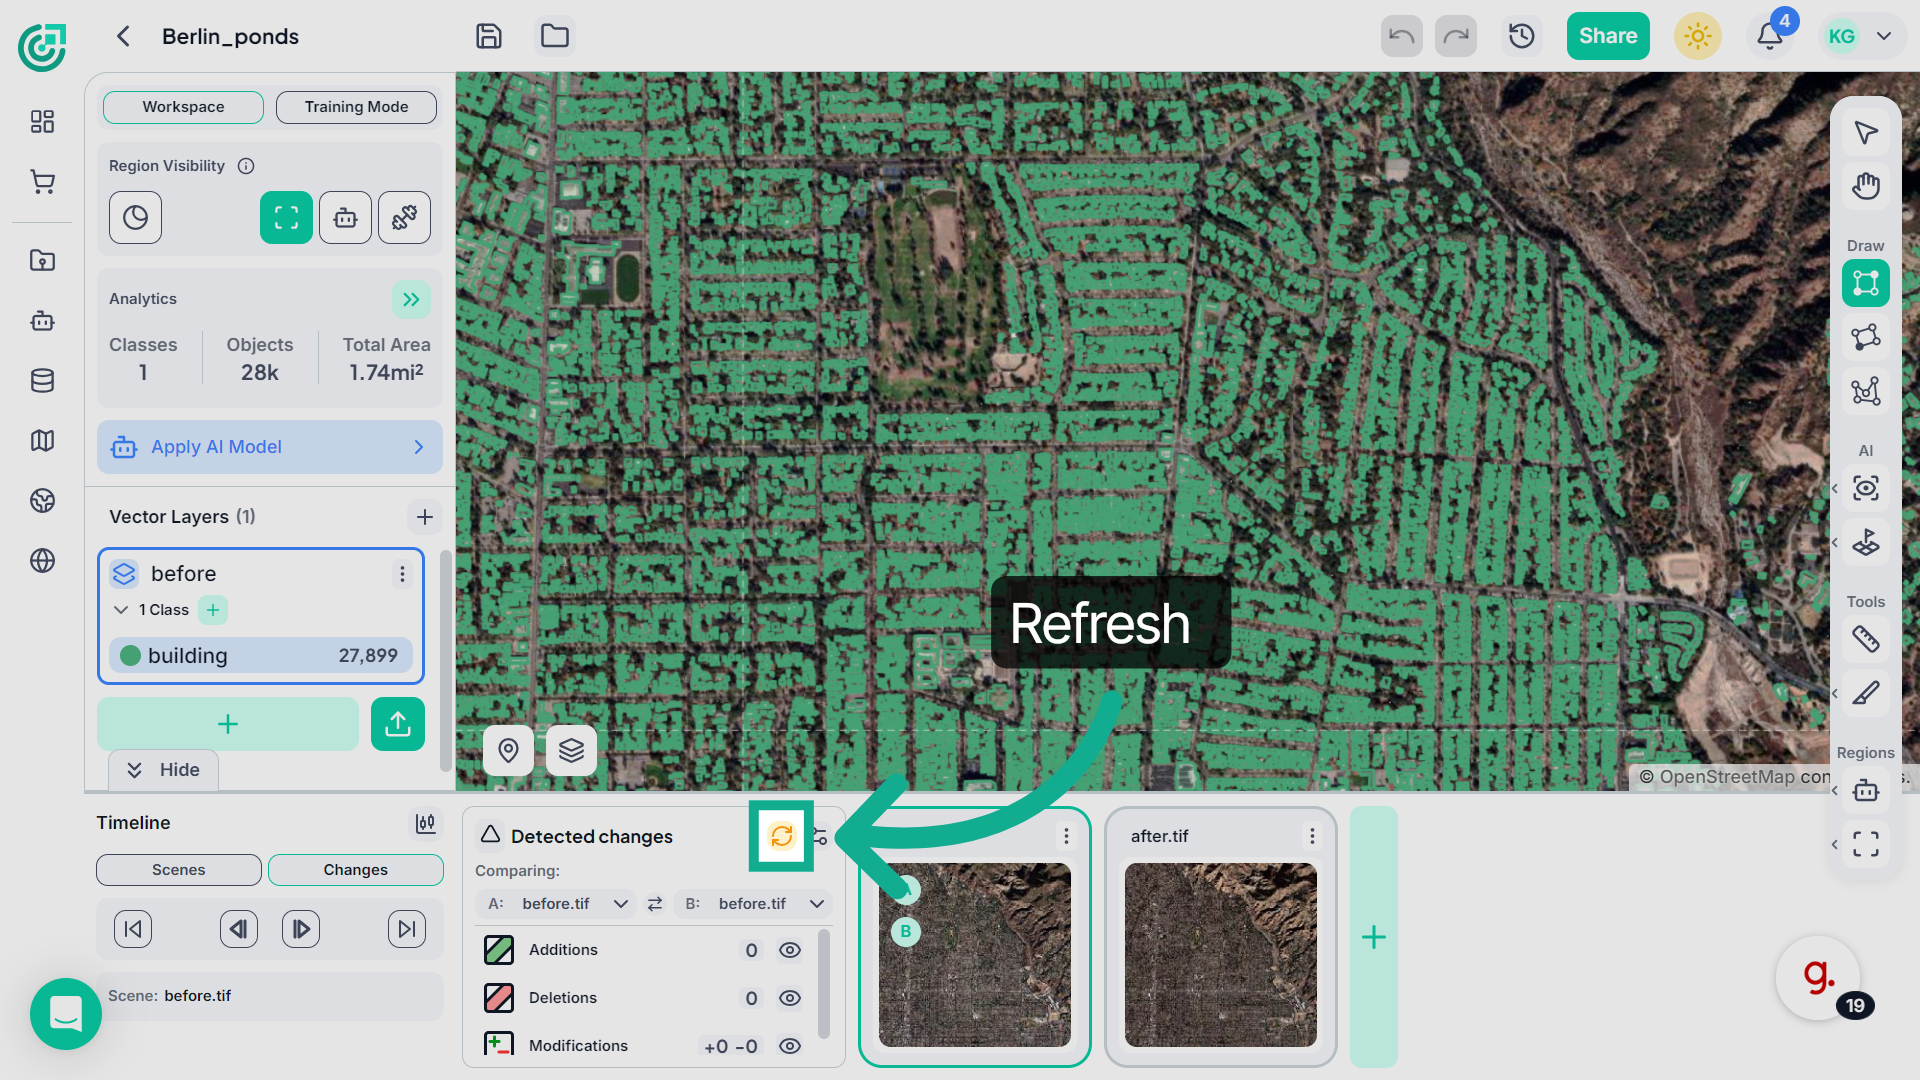
9. Open Comparison Settings
Click the Refresh icon to run the change detection process. This analyzes the selected scene and identifies any changes over time.
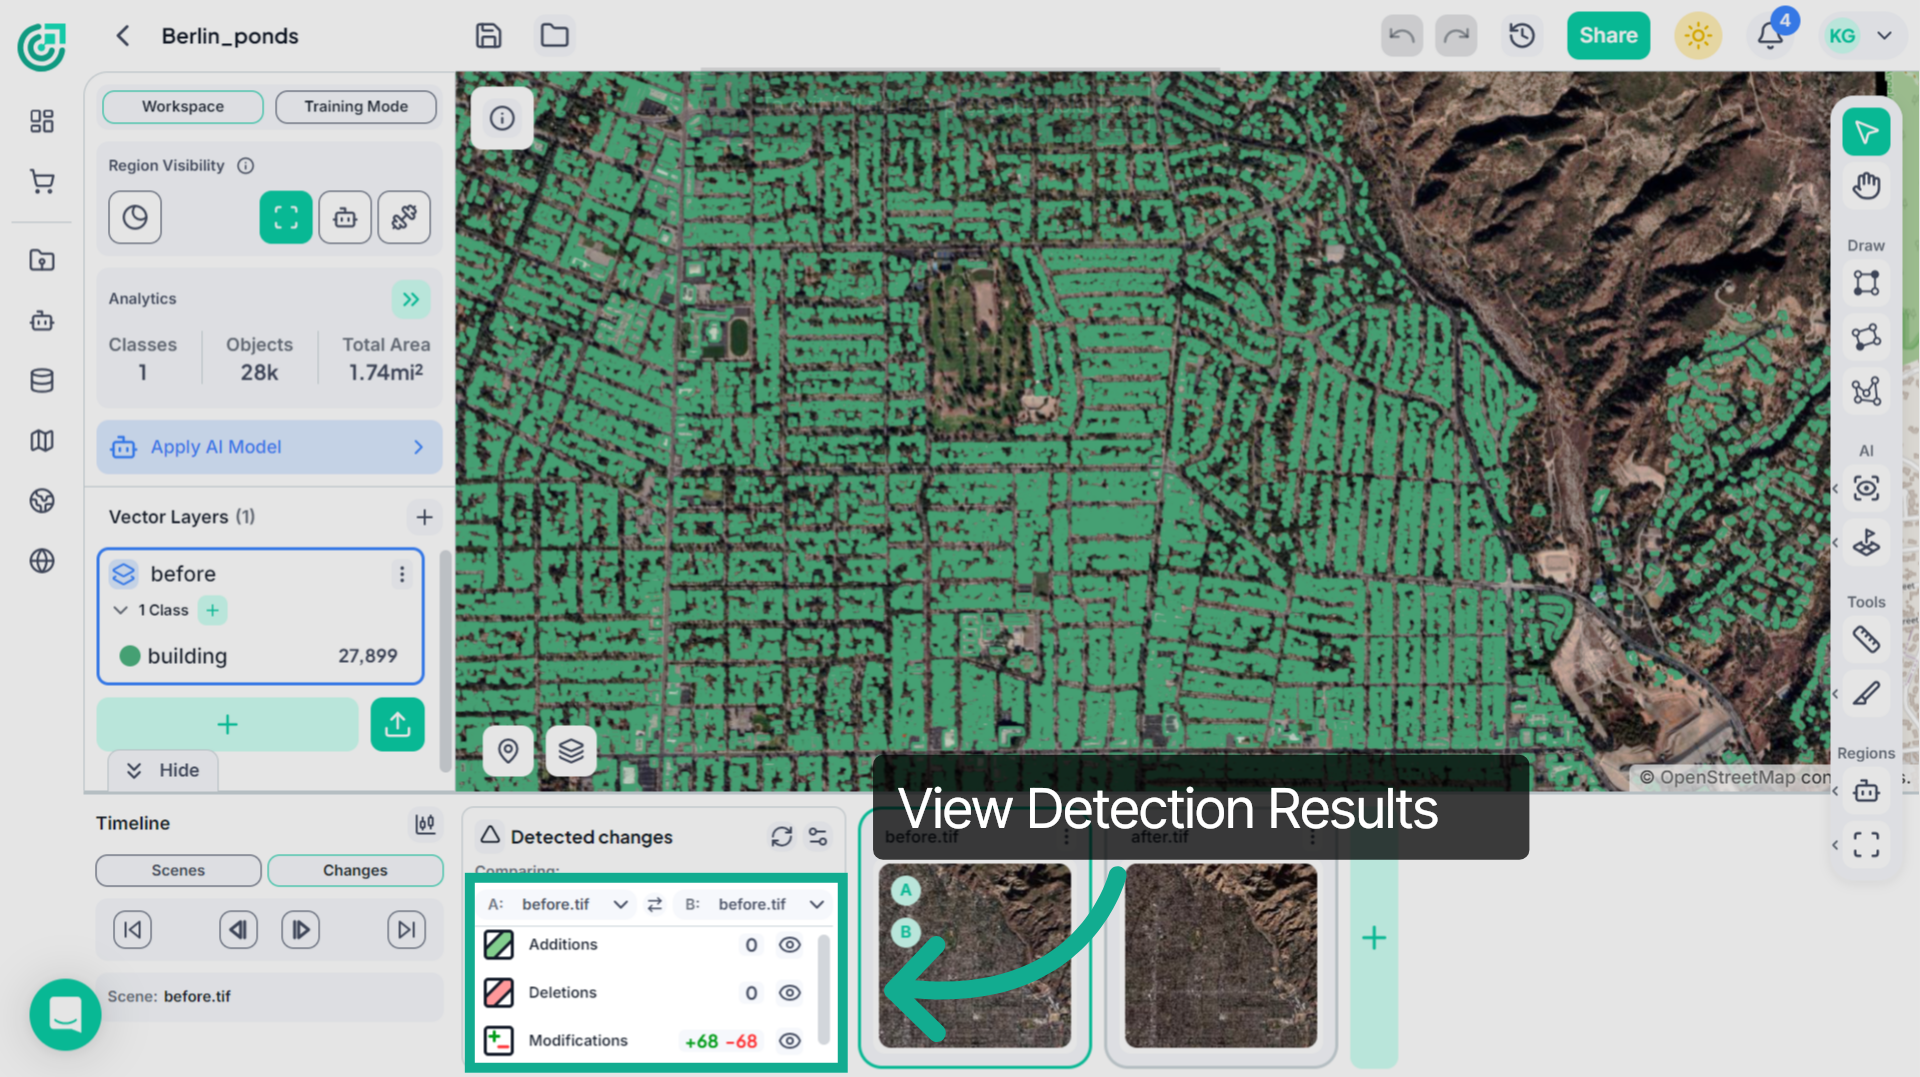
10. Detection Results
Once refreshed, FlyPix recalculates the results and displays detected Additions, Deletions, and Modifications.
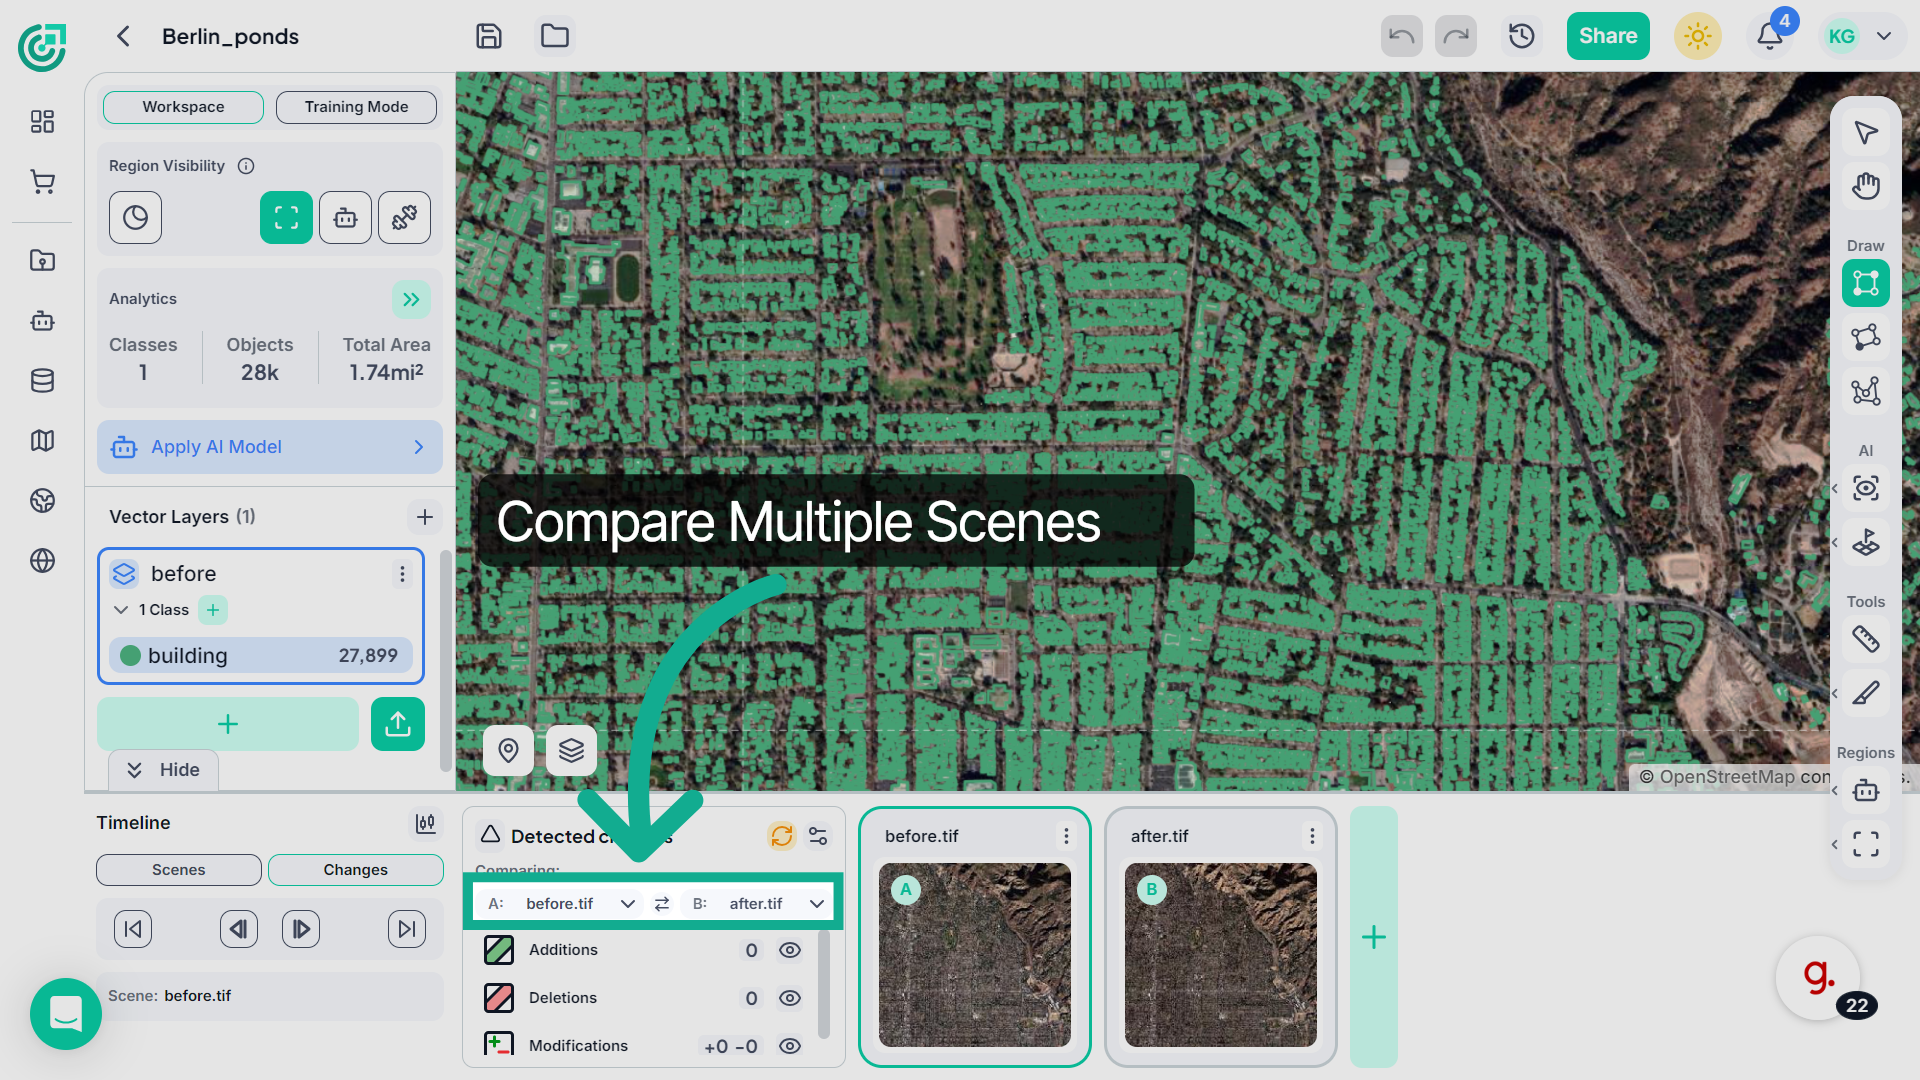
11. Compare Scenes Between Multiple Files
To compare different scenes, open the Comparing dropdown and select the files you want to analyze. For example, you can compare different scenes captured at different time periods to detect changes in the selected area.
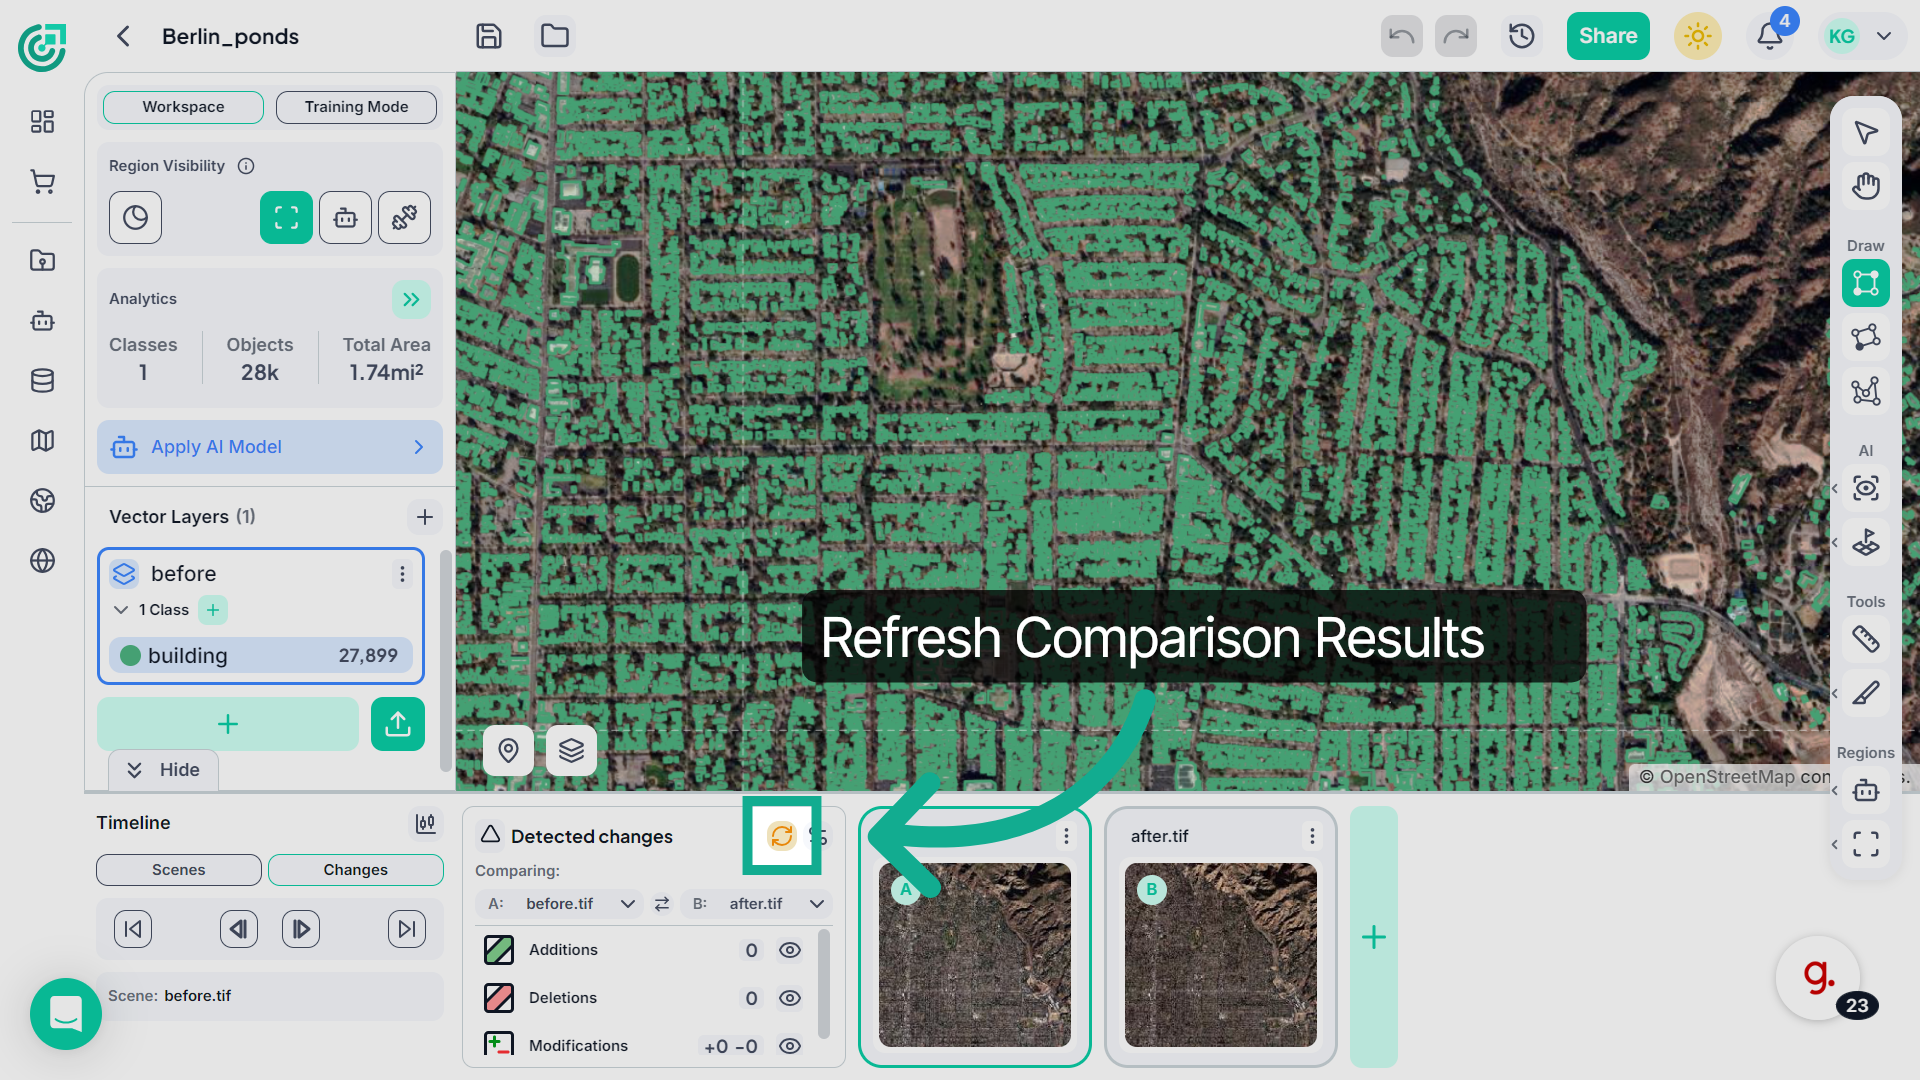
12. Open Analysis Details
Click the Refresh button again to update the comparison and calculate the detected changes between the selected scenes.
13. View Detected Changes
After the comparison is complete, FlyPix displays the detected Additions, Deletions, and Modifications identified between the selected scenes.
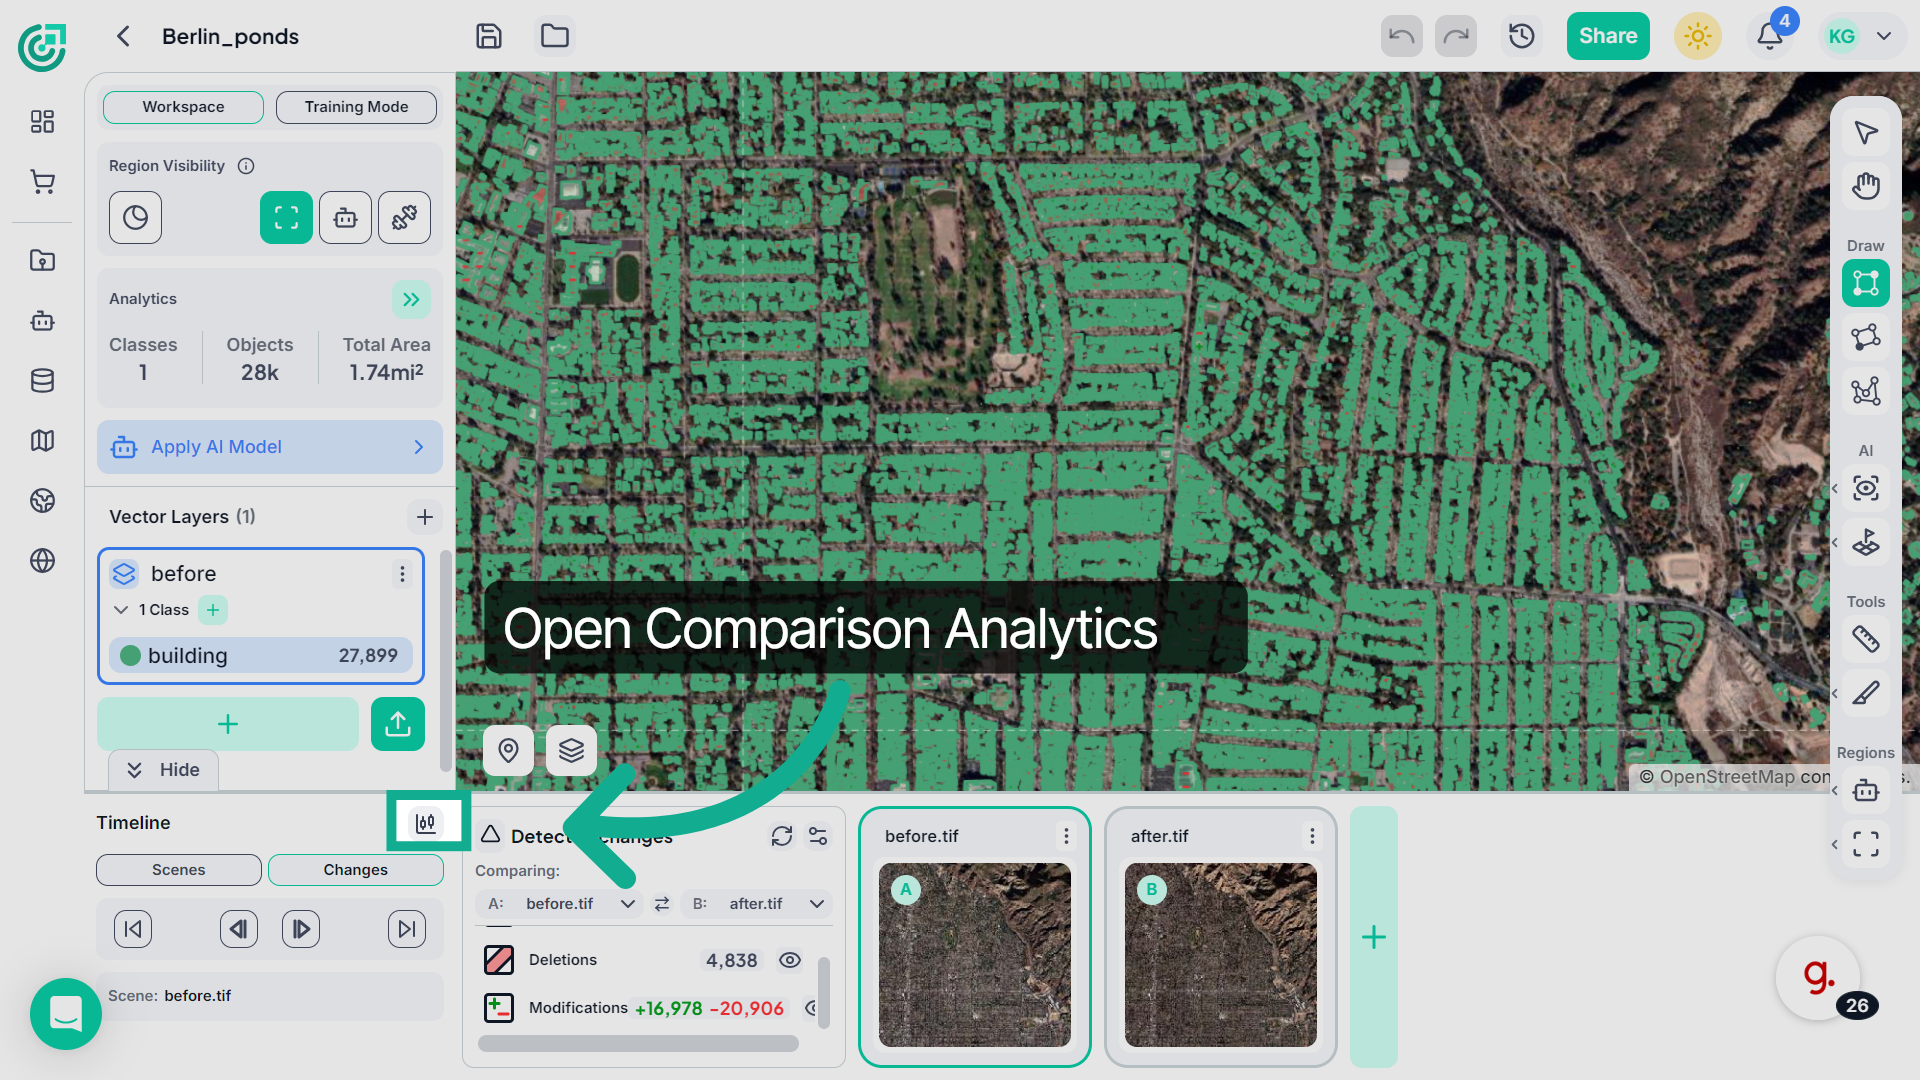
14. Open Workspace Analytics
Next, click the Comparison Analytics icon to open the Workspace Analytics panel, where you can view analytical insights for the compared scenes.
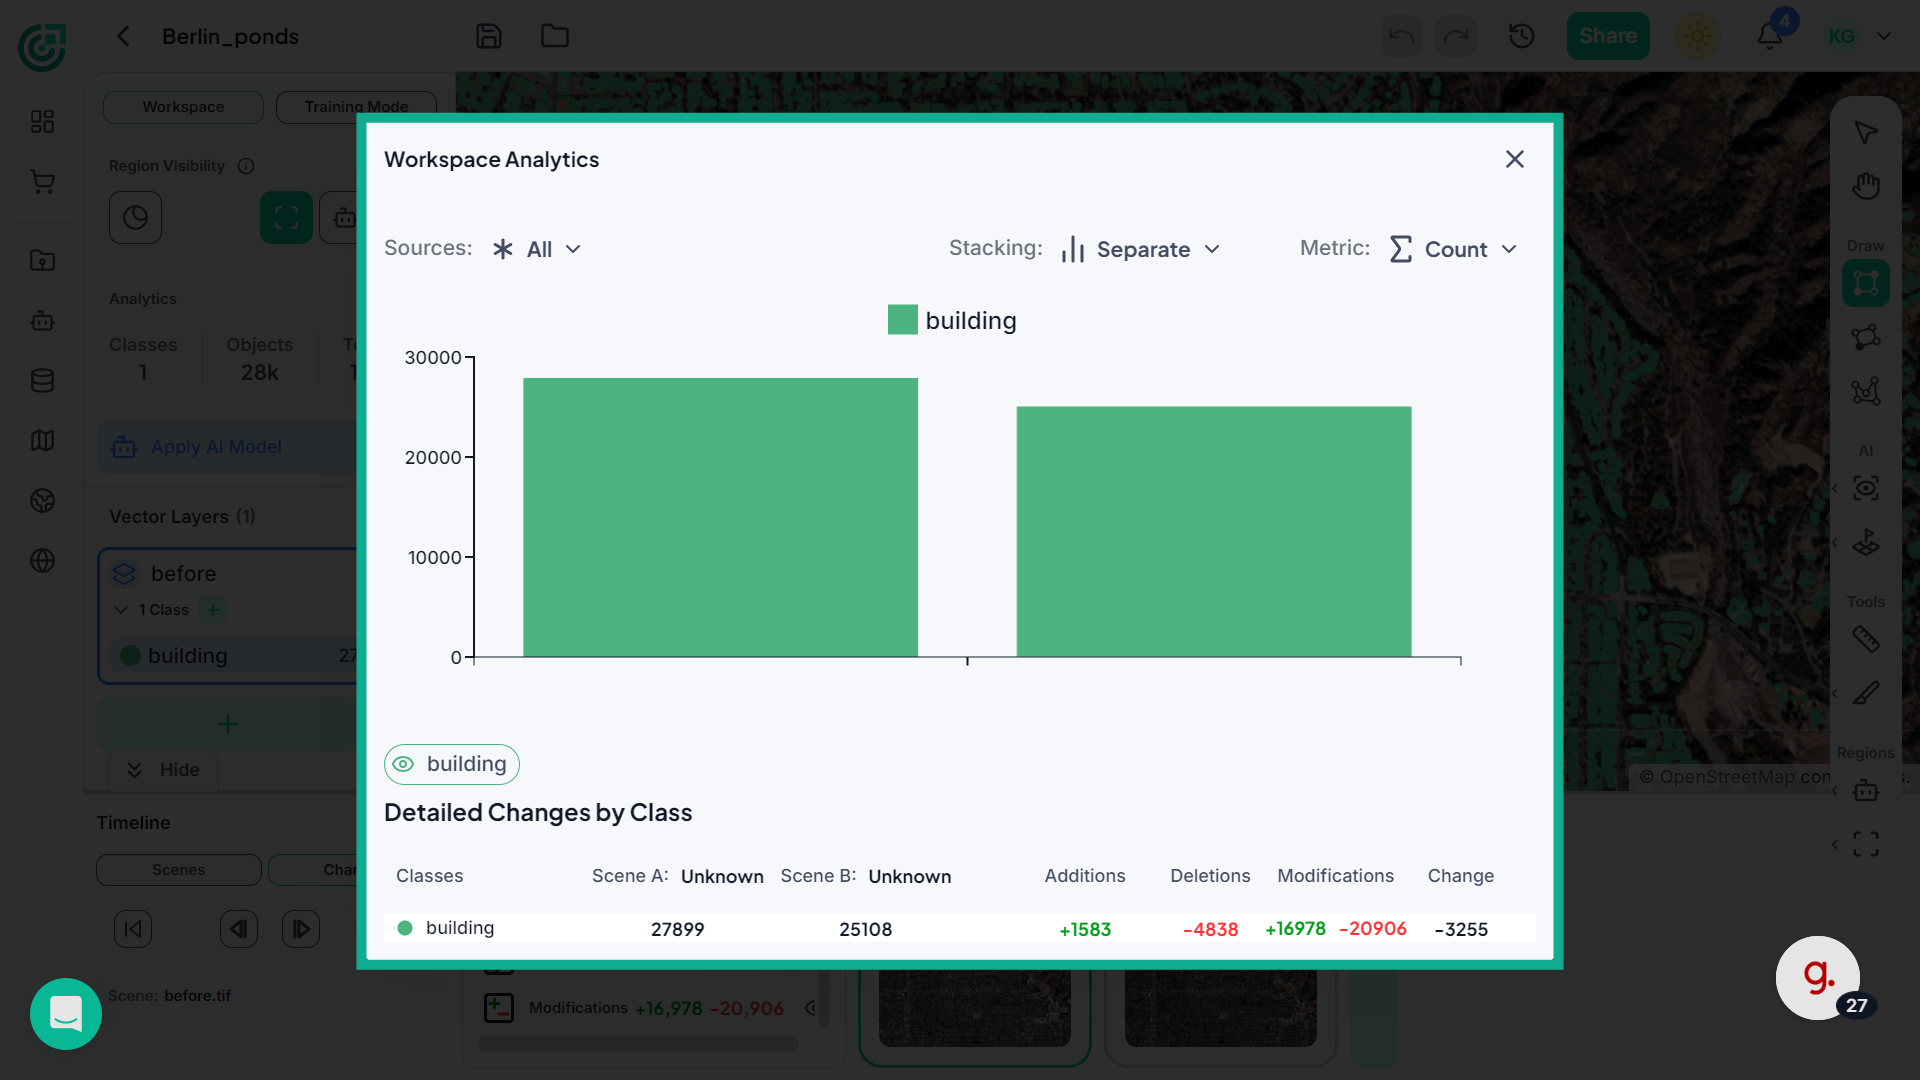
15. Review Scene Statistics
Here you’ll see a chart displaying the detected objects and their counts across the compared scenes. This helps you quickly understand how object counts change over time.
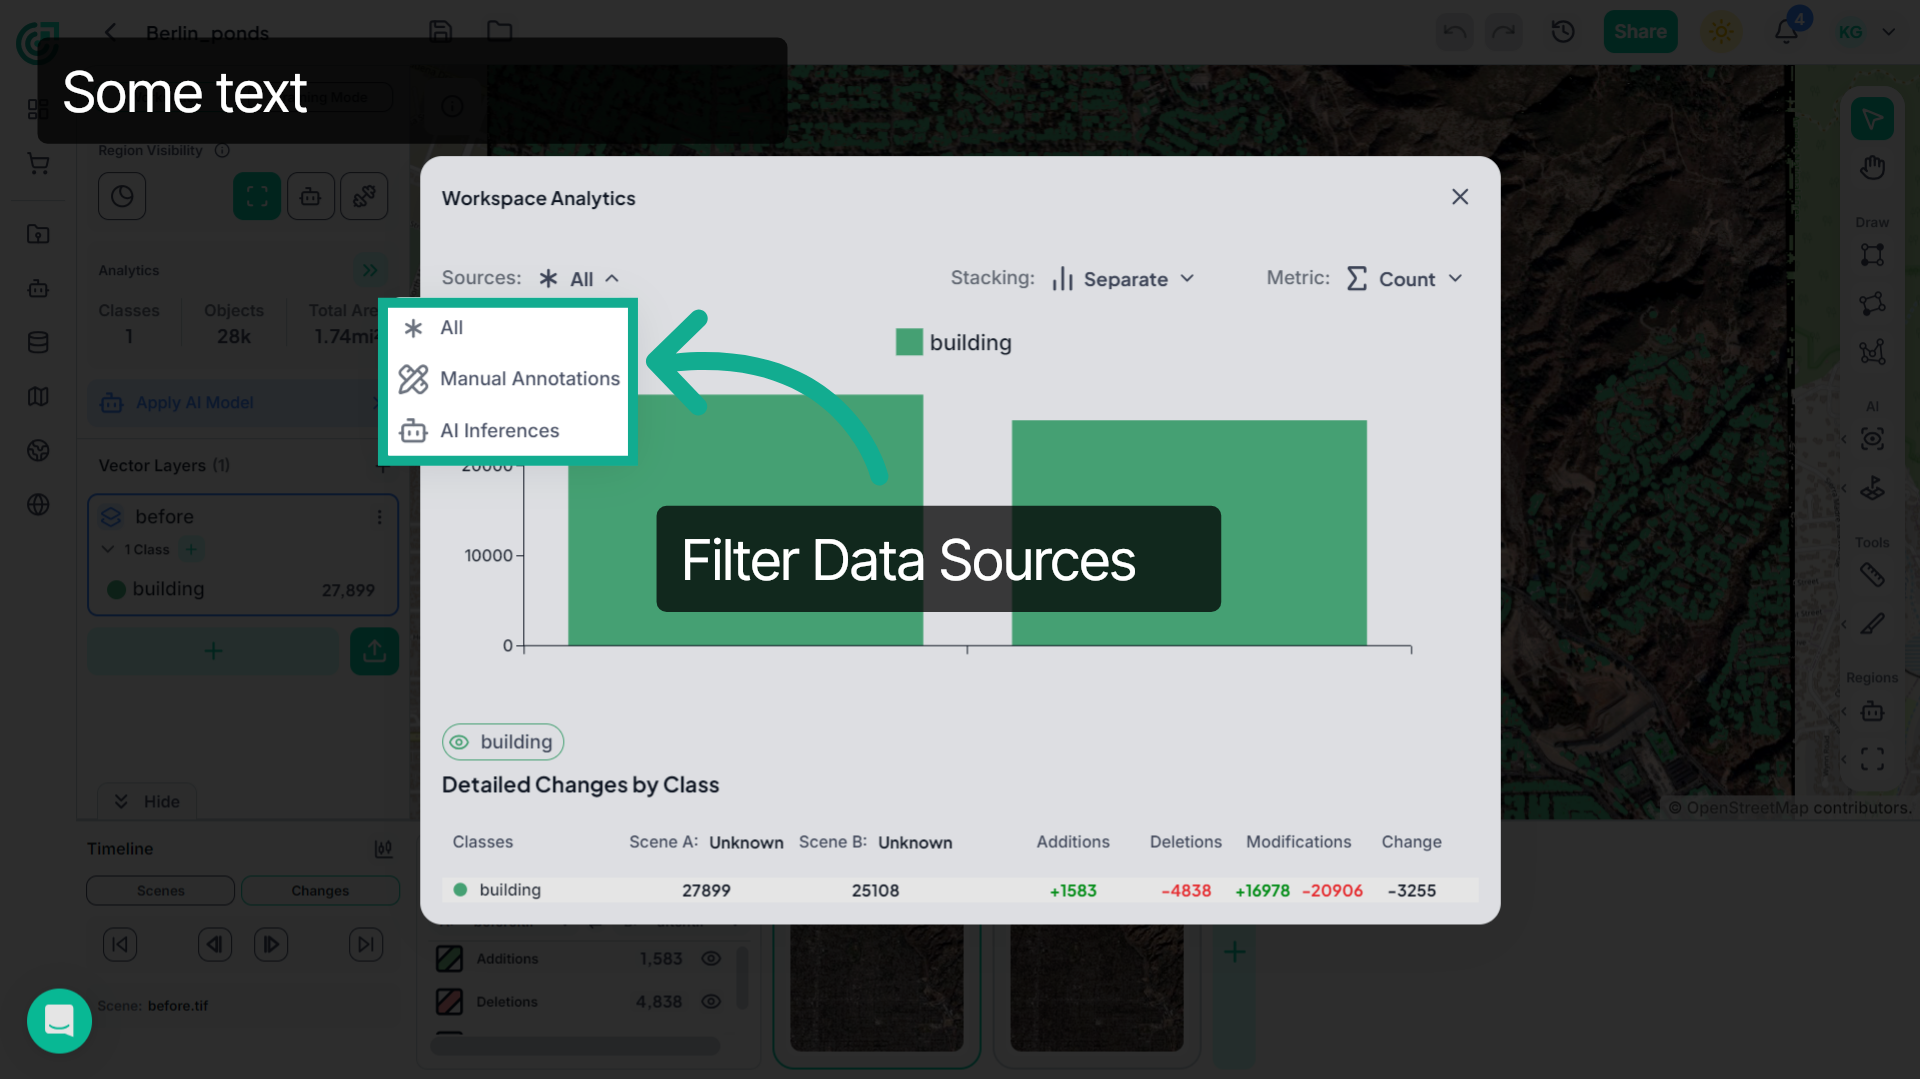
16. Filter Data Sources
Click the Sources dropdown to filter the data used for analysis. You can choose between All, Manual Annotations, or AI Inferences depending on the data source you want to analyze.
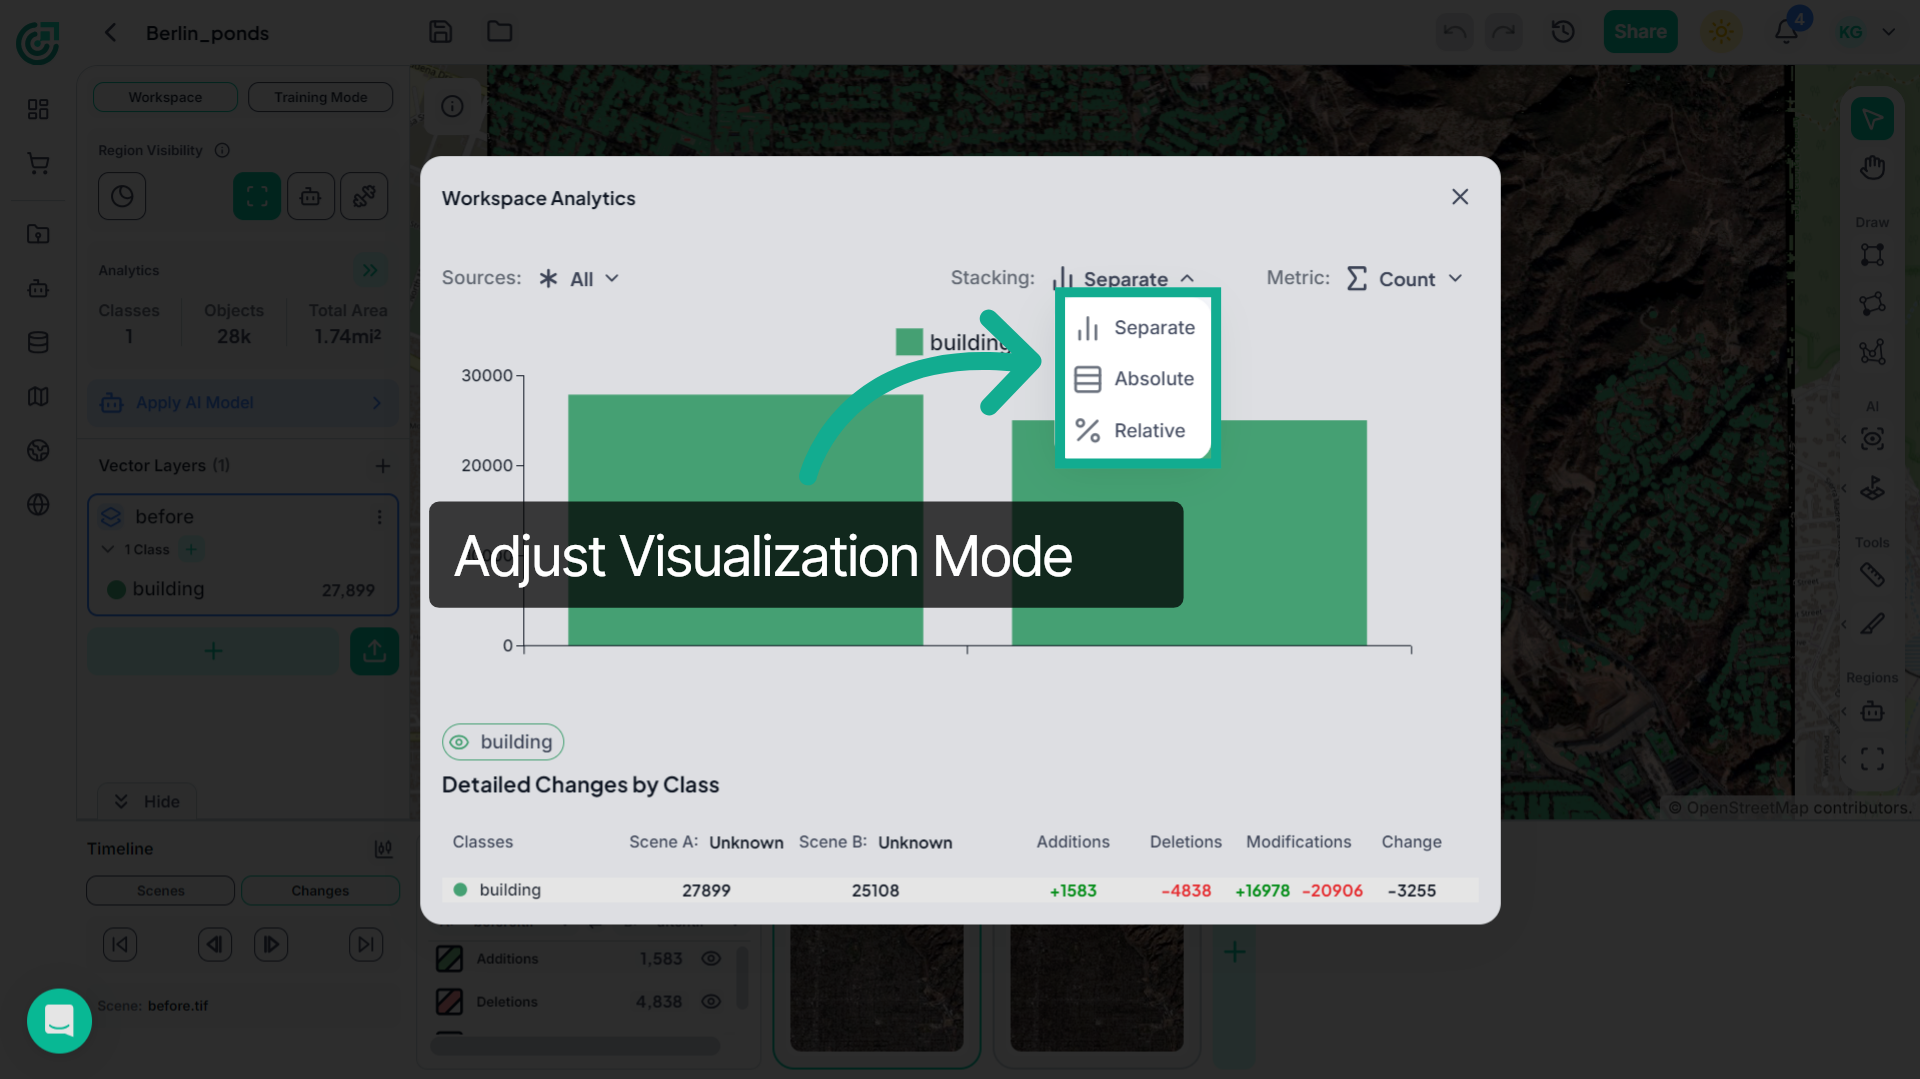
17. Adjust Data Visualization
Next, open the Stacking dropdown to change how the data is visualized. Select Separate, Absolute, or Relative to view the comparison results in different visualization formats.
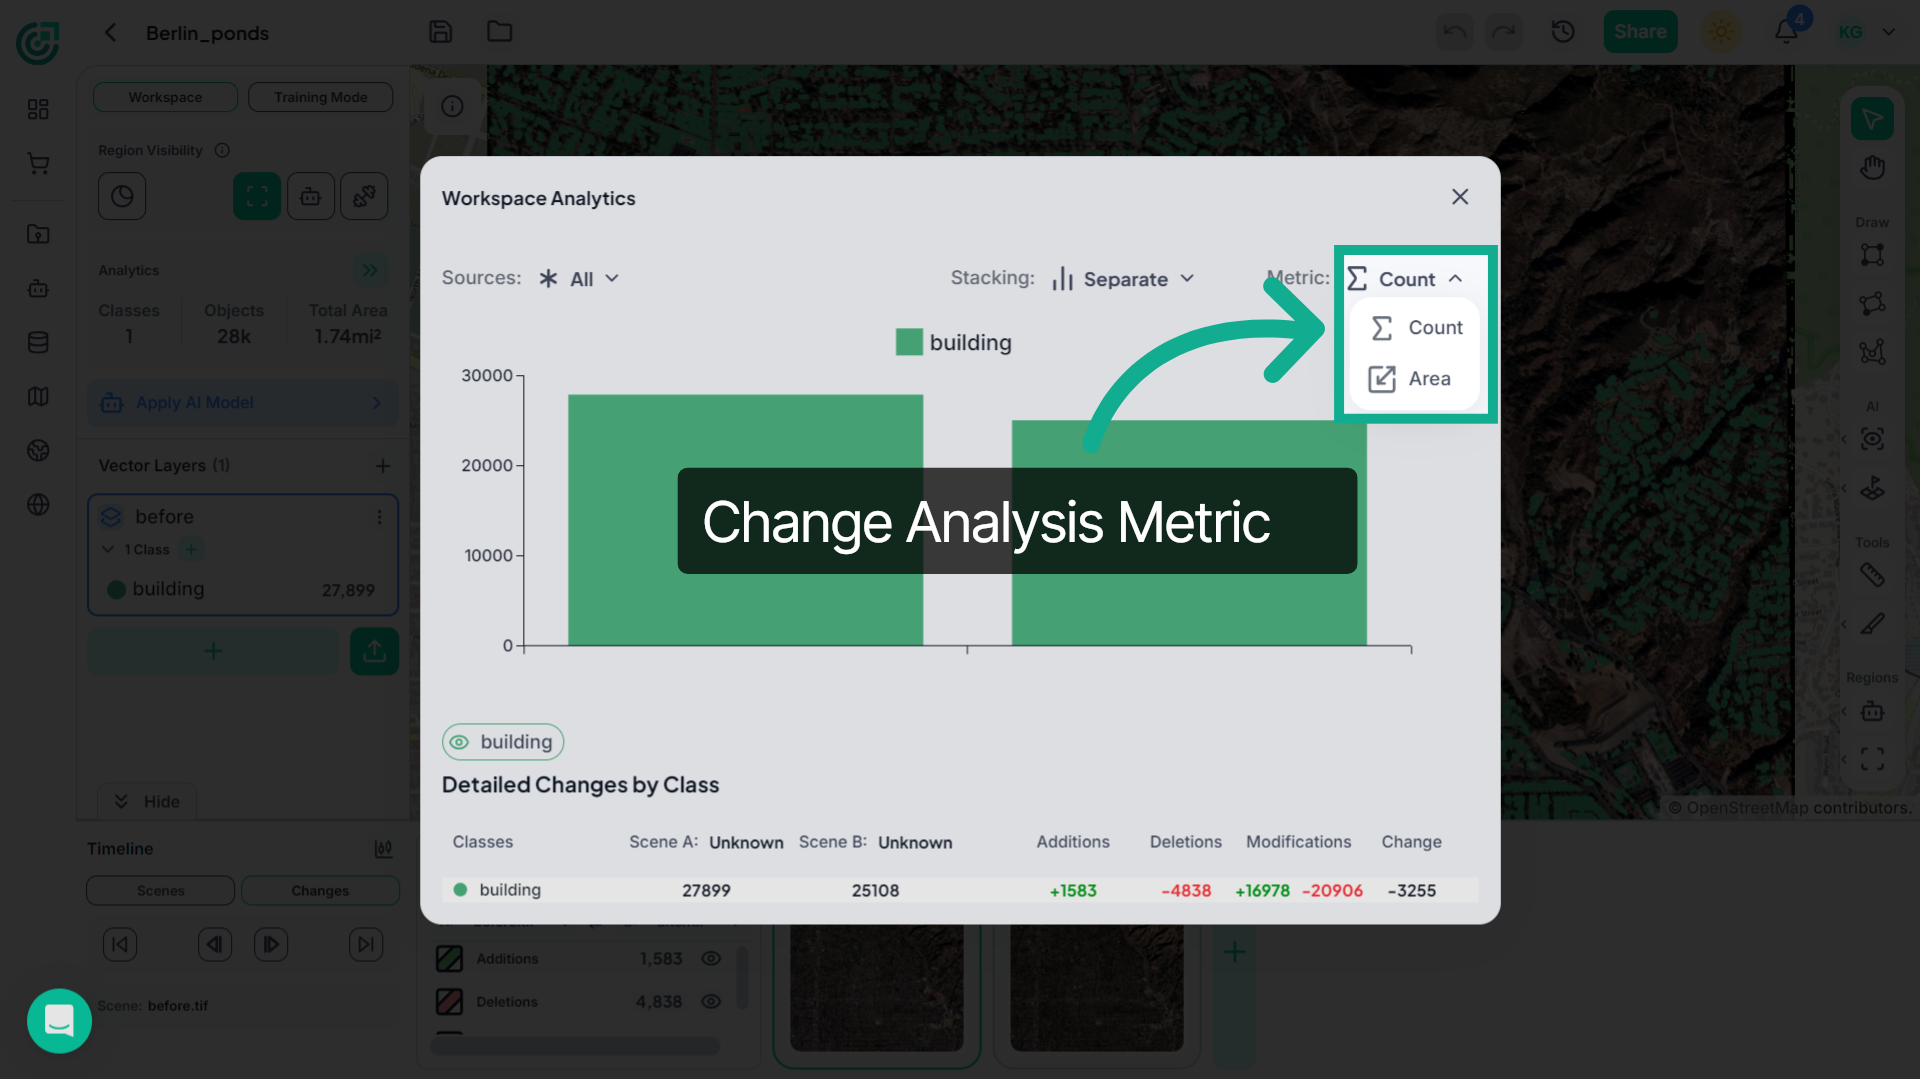
18. Change Analysis Metric
Open the Metric dropdown to change the analysis type.. Choose Count to view the number of detected objects or Area to analyze the total area covered by those objects.
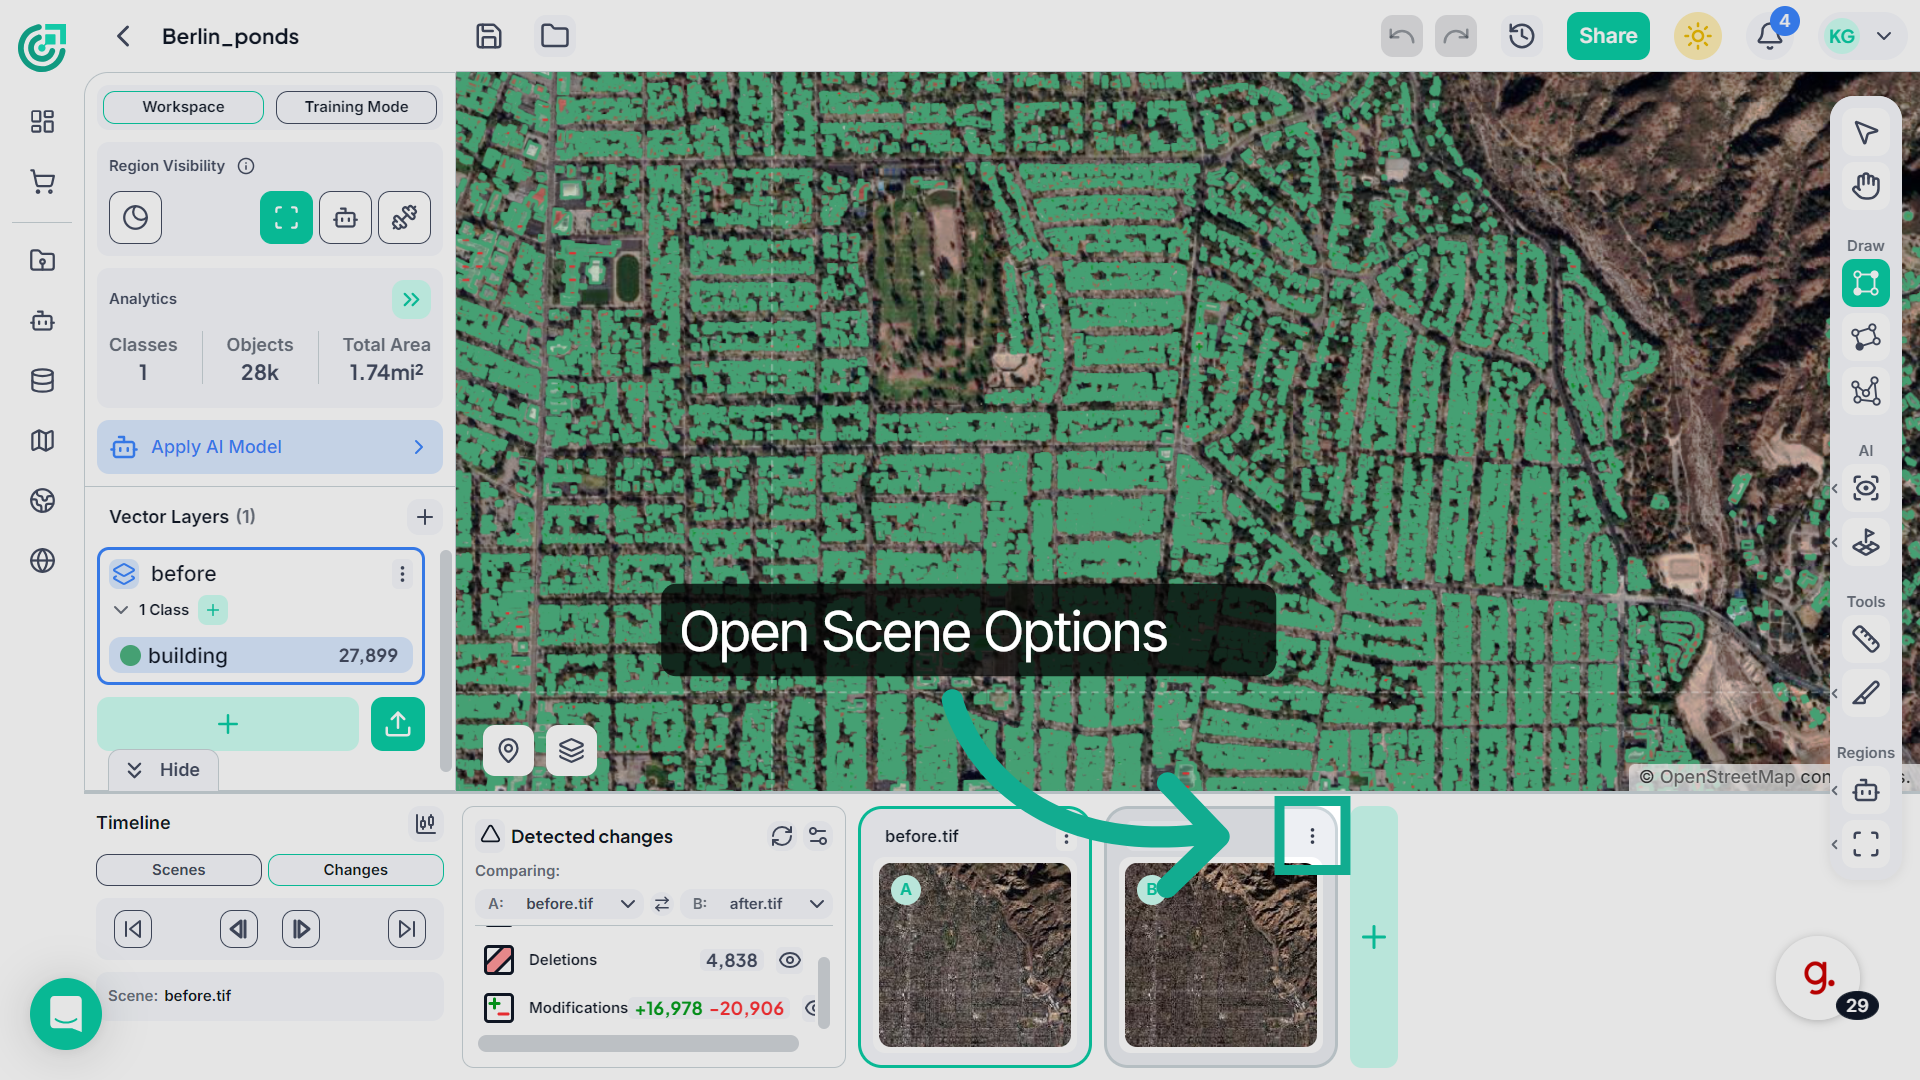
19. Manage Scene Options
You can also manage scenes using the three-dot menu on each scene card.
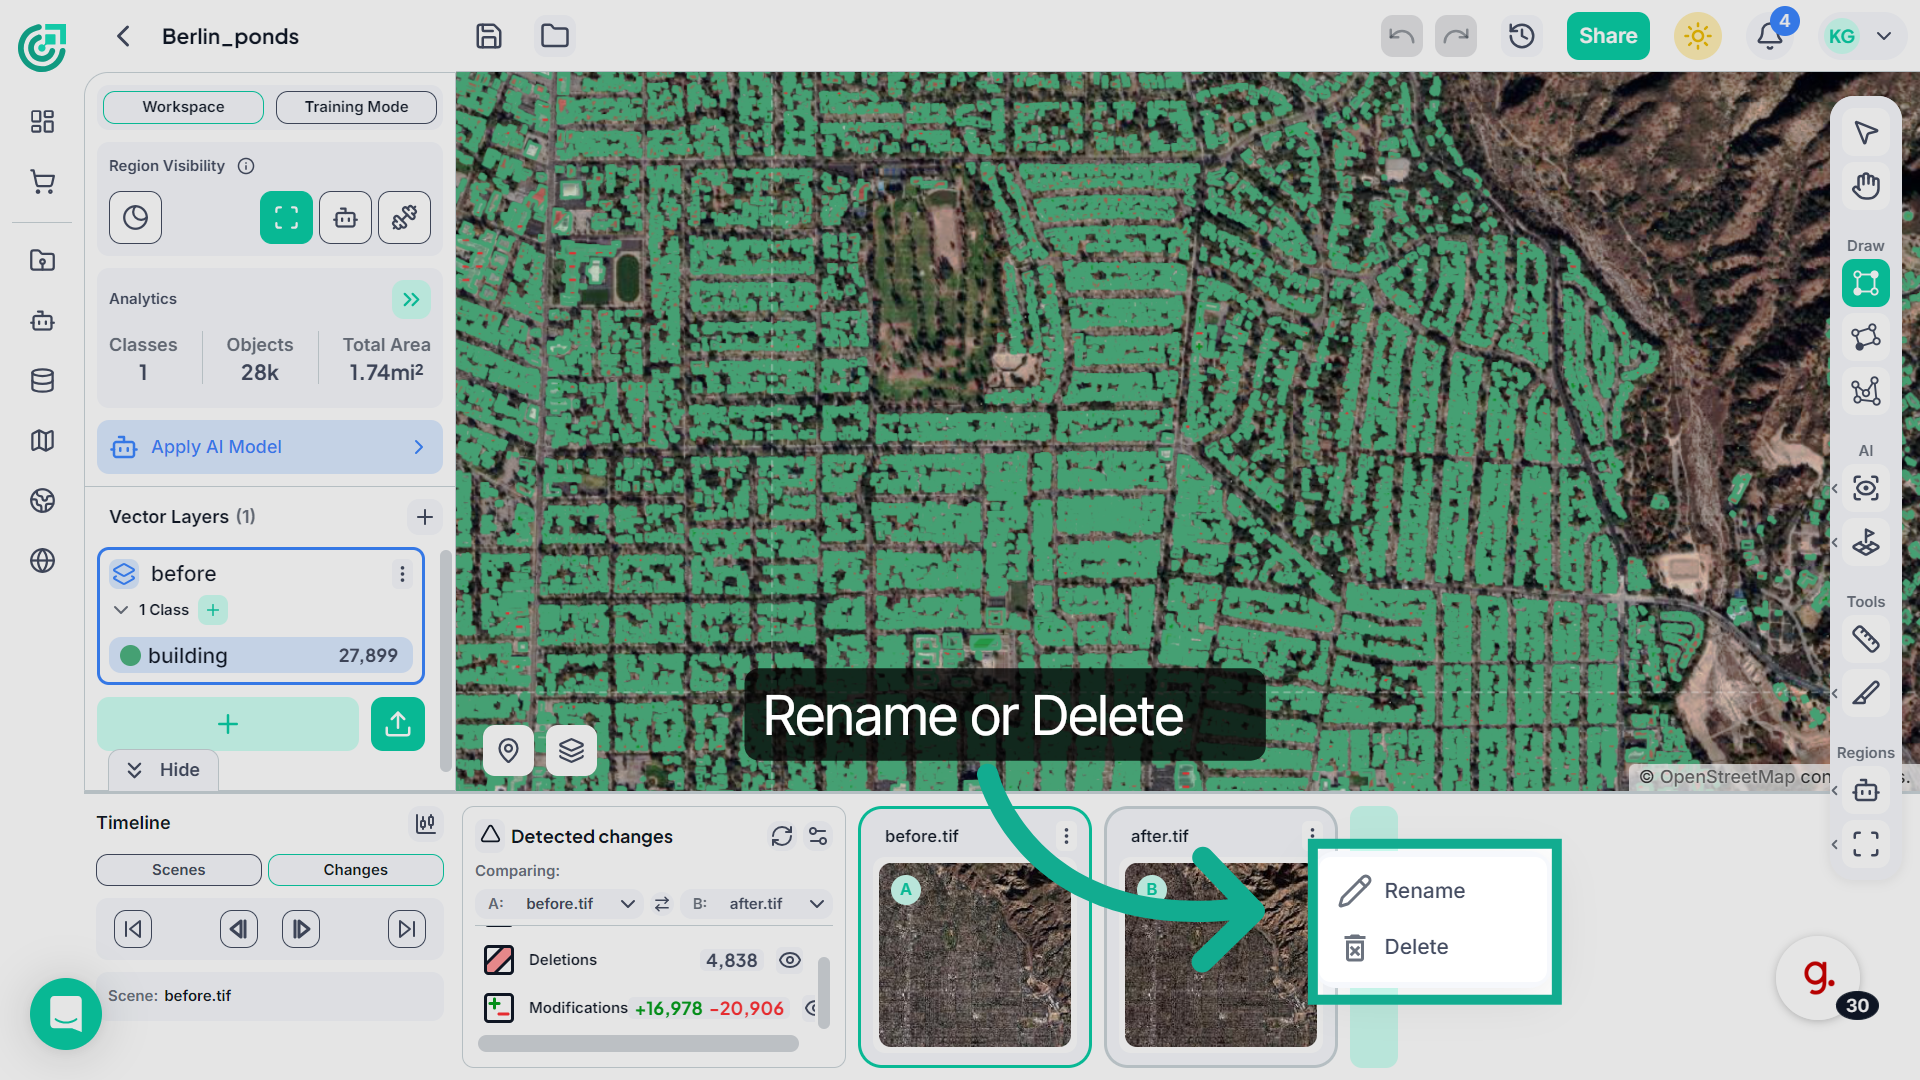
20. Rename or Delete Scenes
From this menu, you can rename the scene or delete it depending on the action you want to perform.
This demo highlighted how FlyPix AI enables powerful geospatial analysis by allowing you to manage scenes, perform time series comparisons, and detect changes across satellite imagery. Use these tools to gain deeper insights into spatial data and monitor changes over time.