Use Analytical Panel
This demo walks you through the Analytical Panel and shows you how to review object distributions, sort detections, and apply filters inside the workspace.
Go to app.flypix.ai
1. Introduction
In this walkthrough, you’ll explore the Analytics panel and learn how to review distribution charts, sort detections, and apply area and confidence filters to refine your analysis.
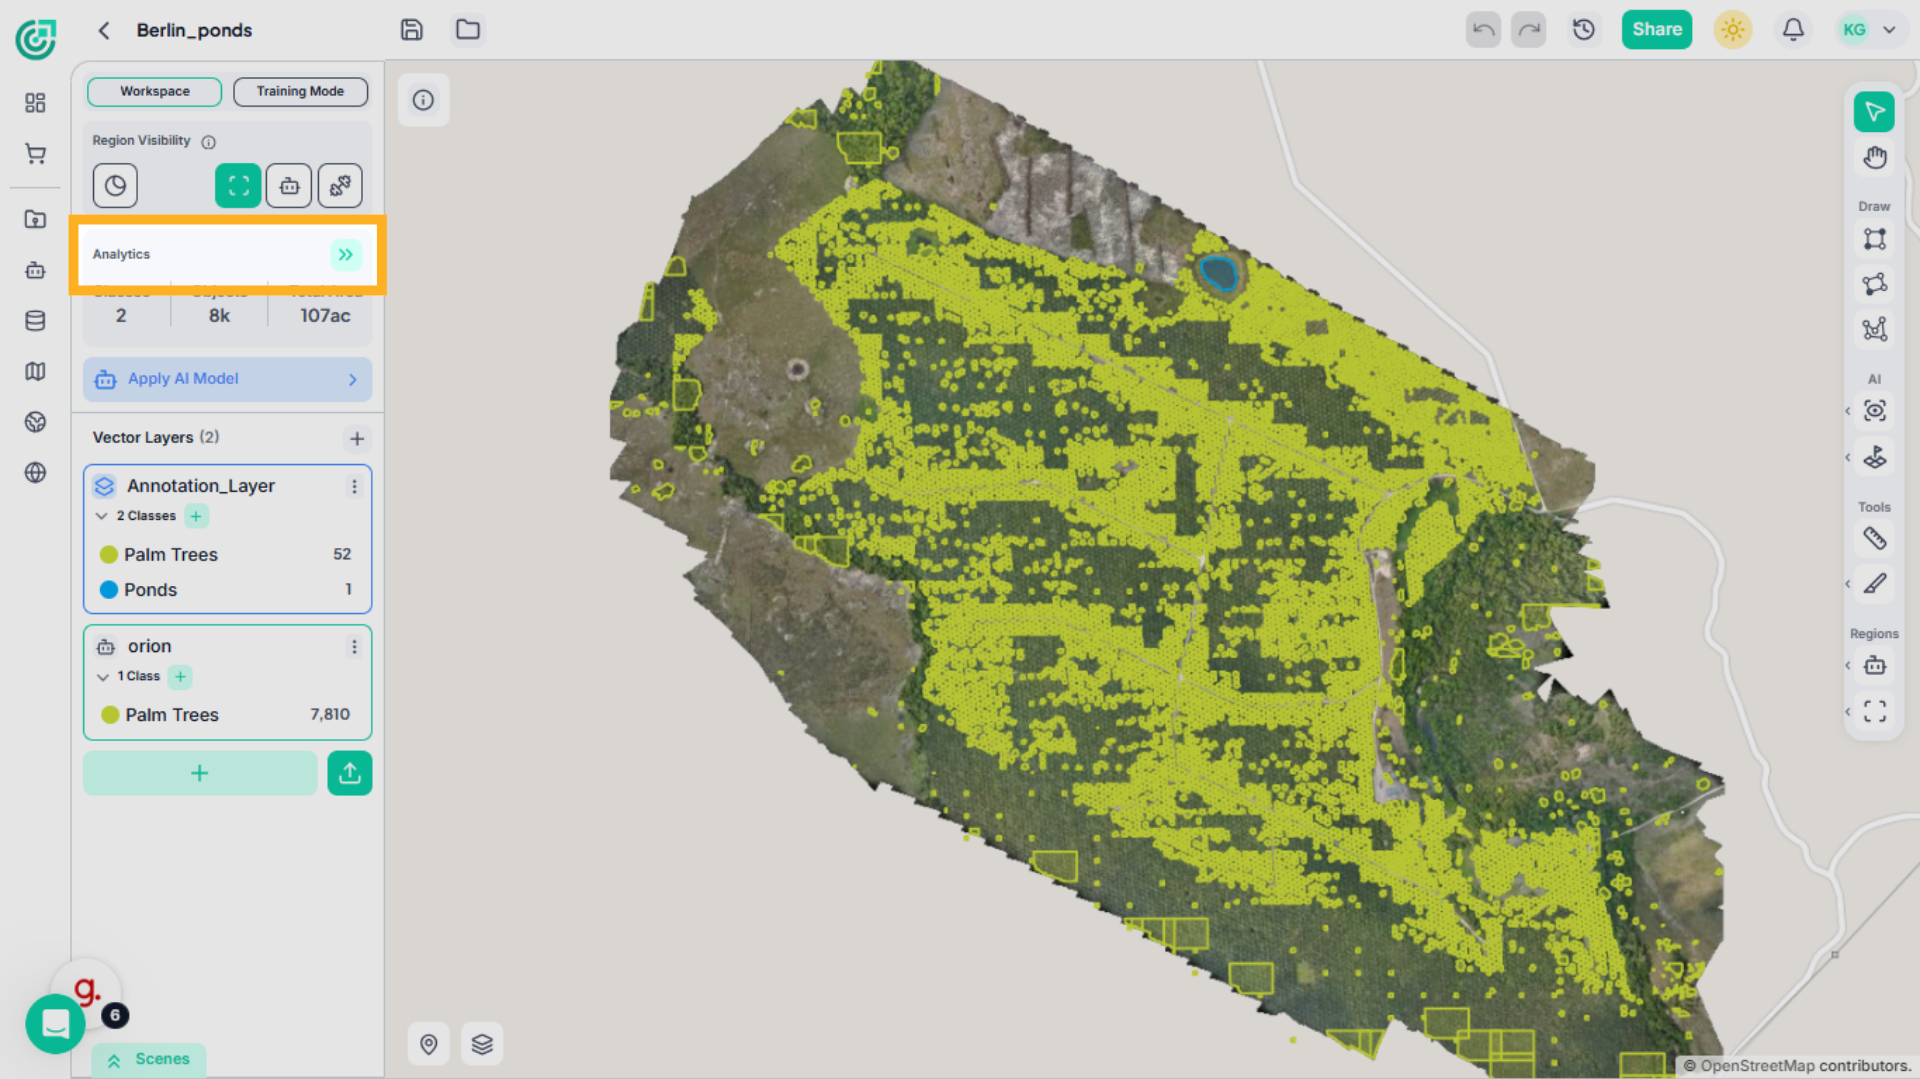
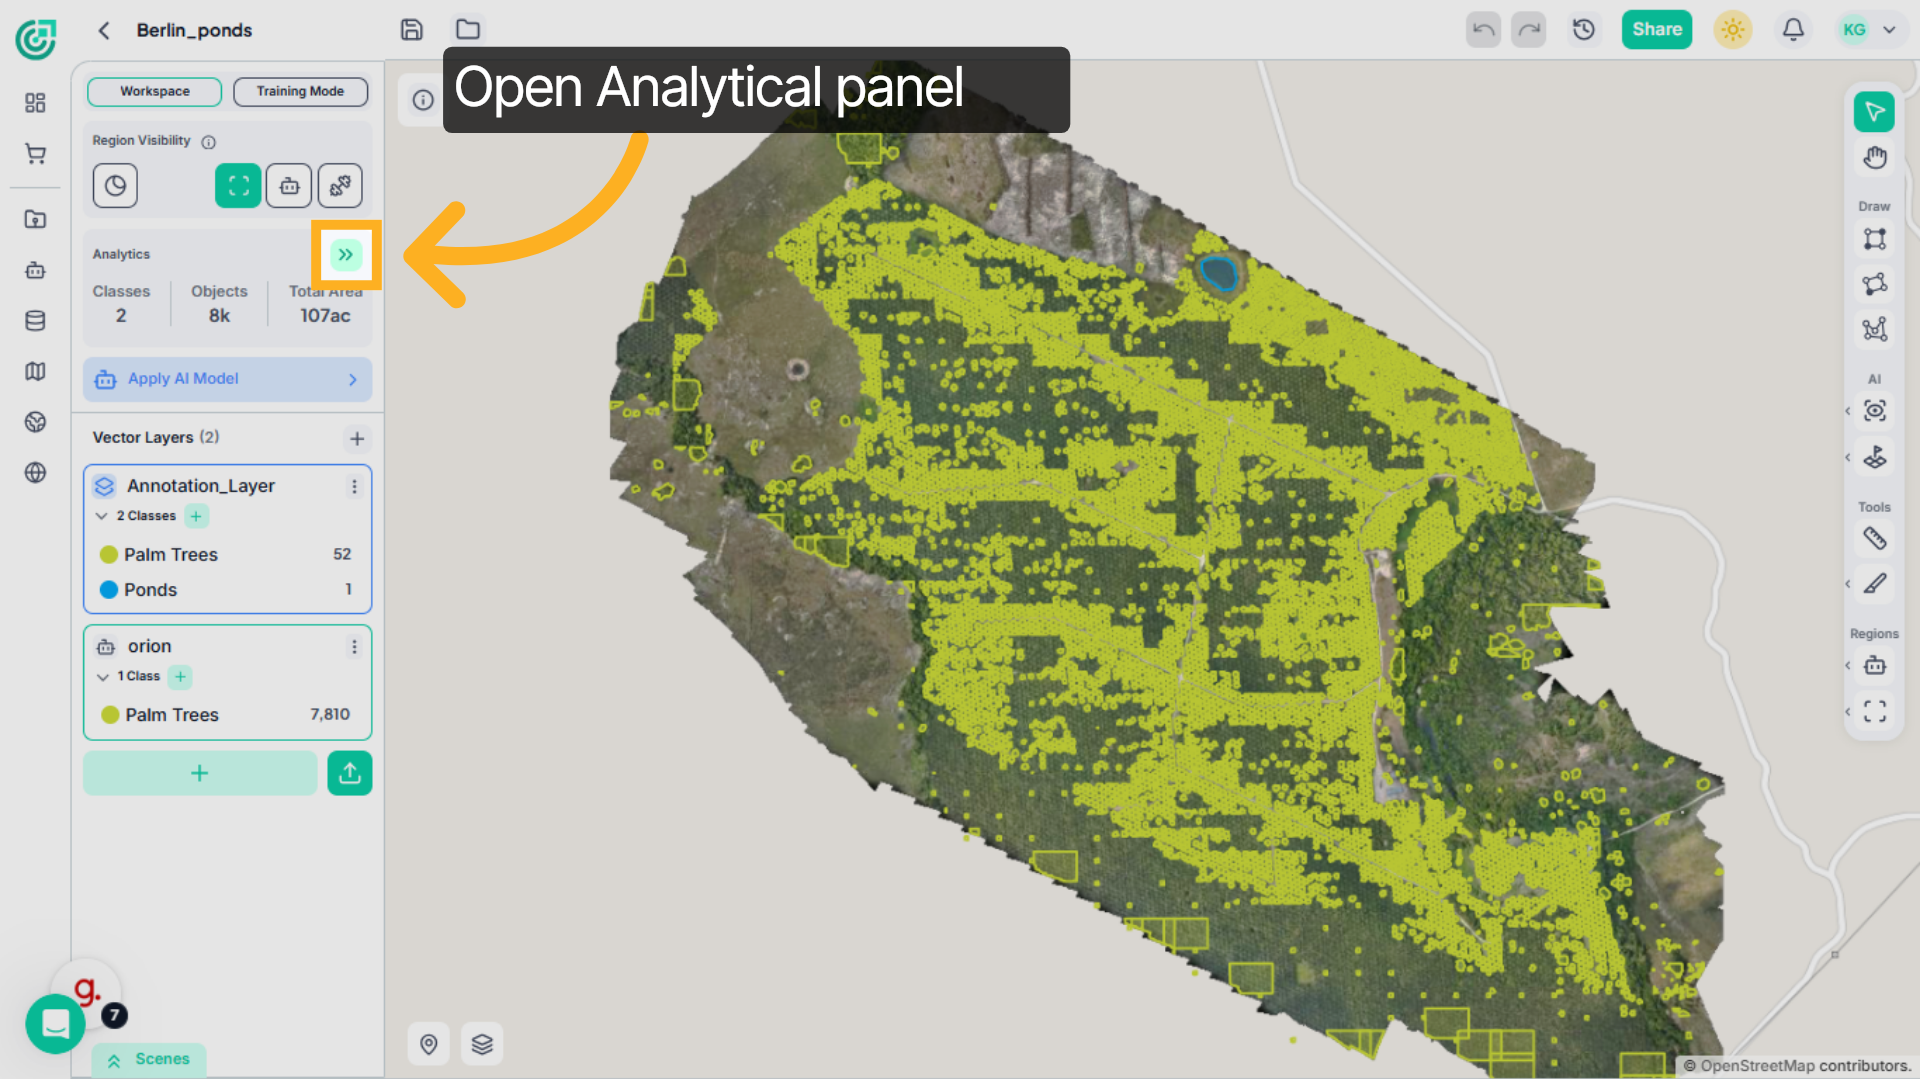
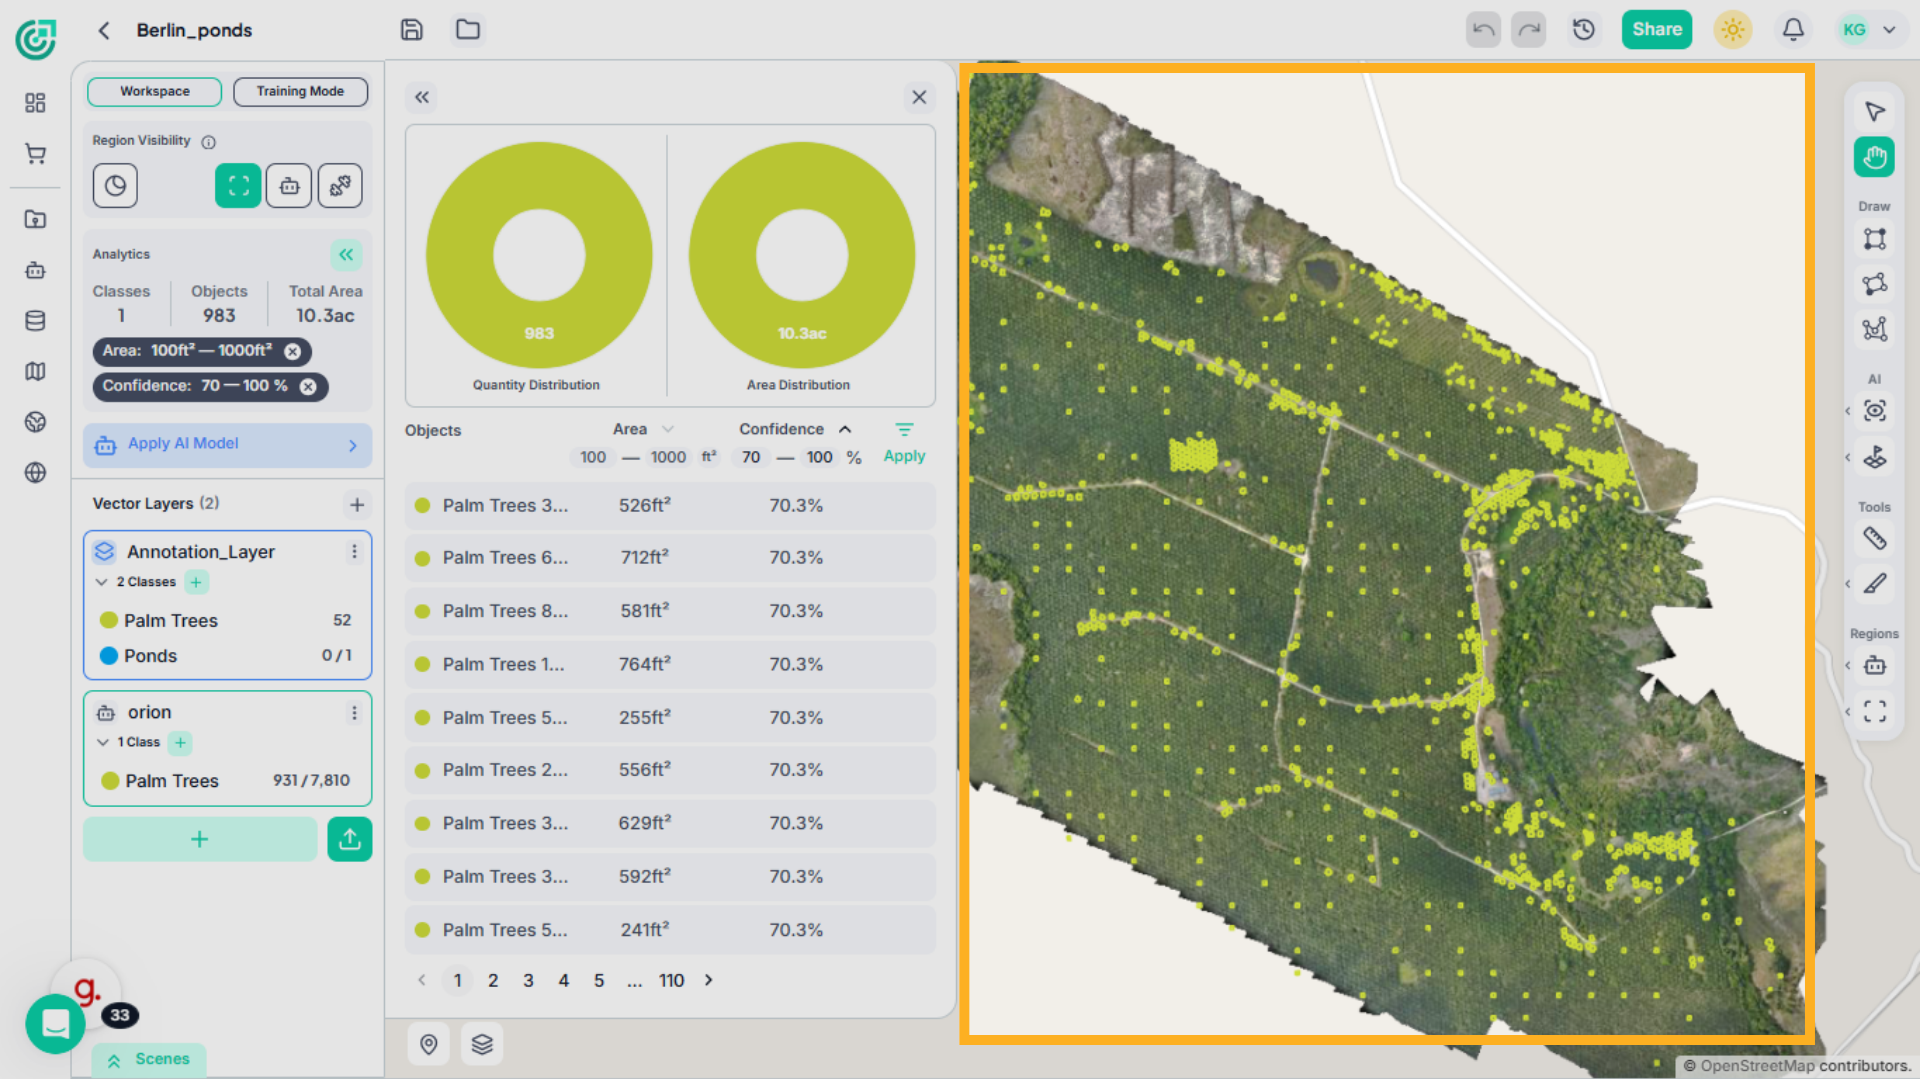
2. Open Analytics Panel
Inside the workspace, expand the Analytics section to access detailed insights about detected objects and dataset metrics.
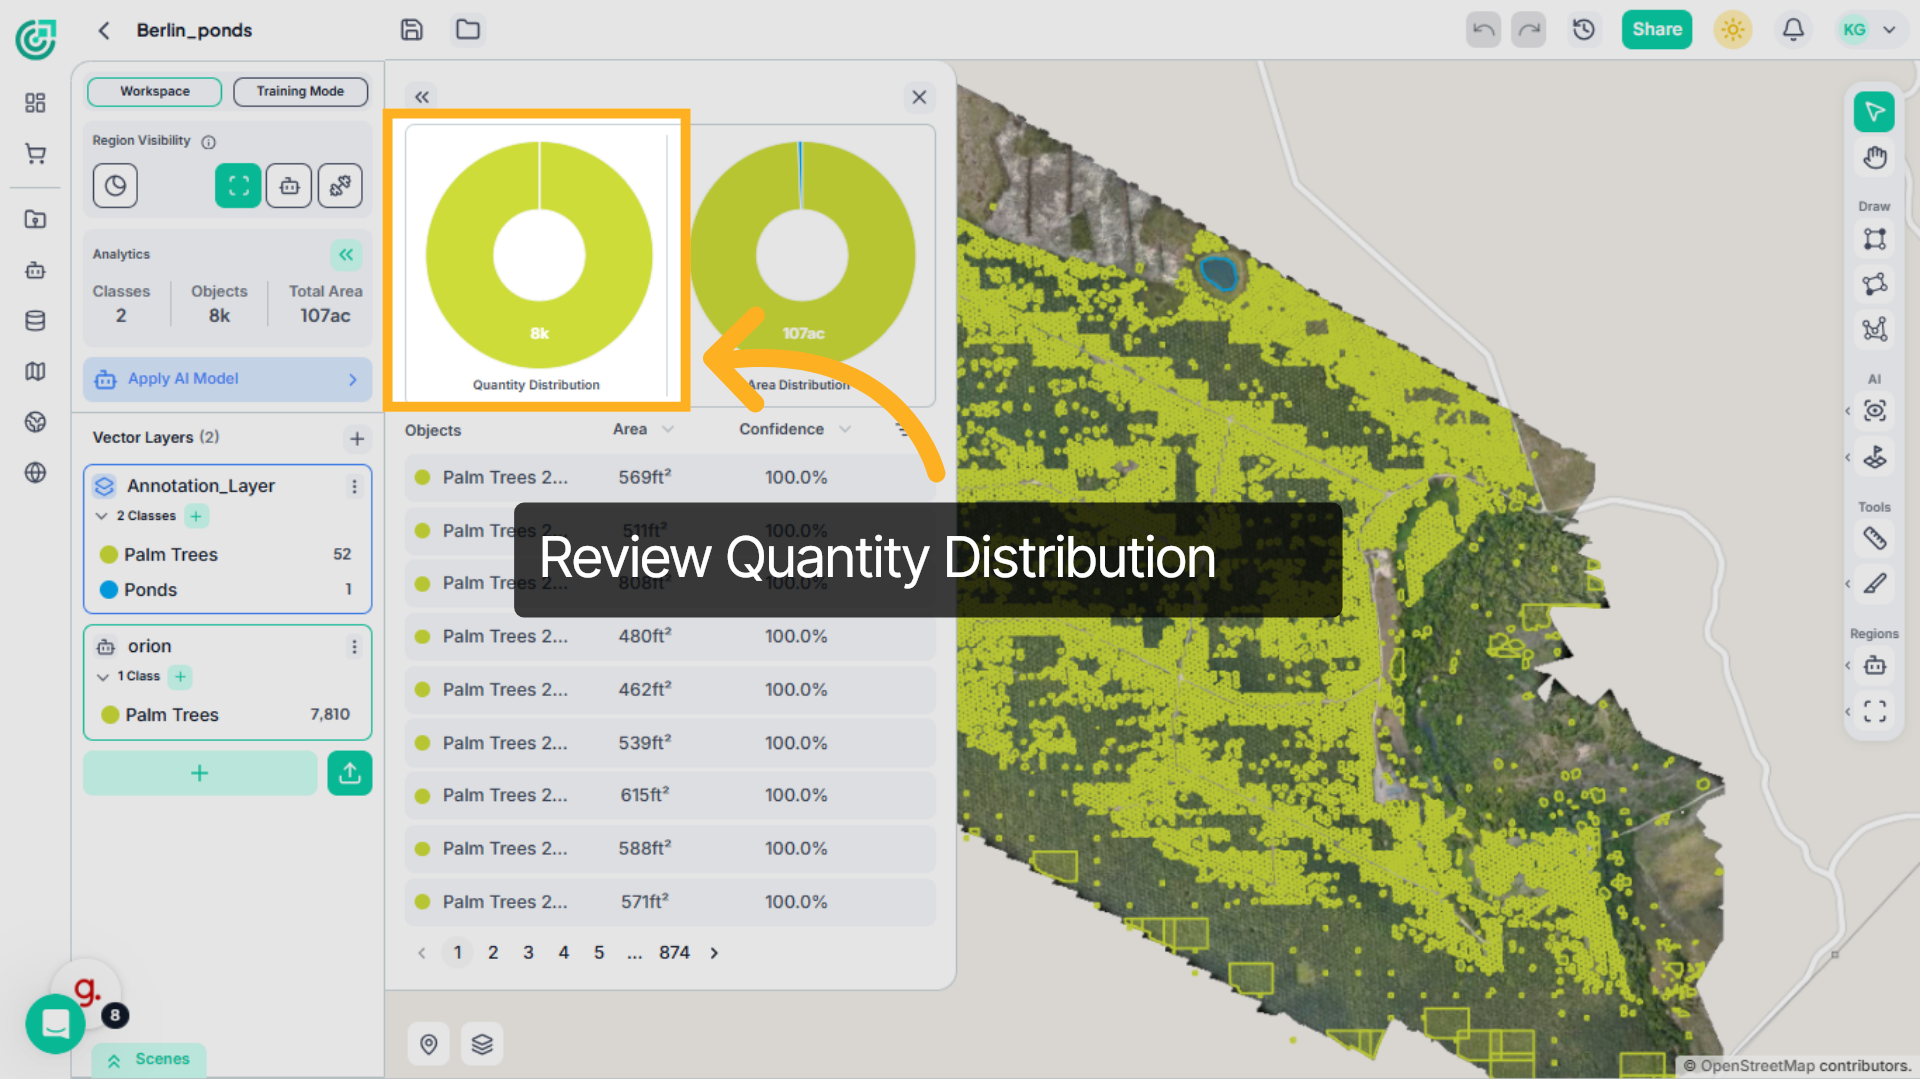
3. Review Quantity Distribution
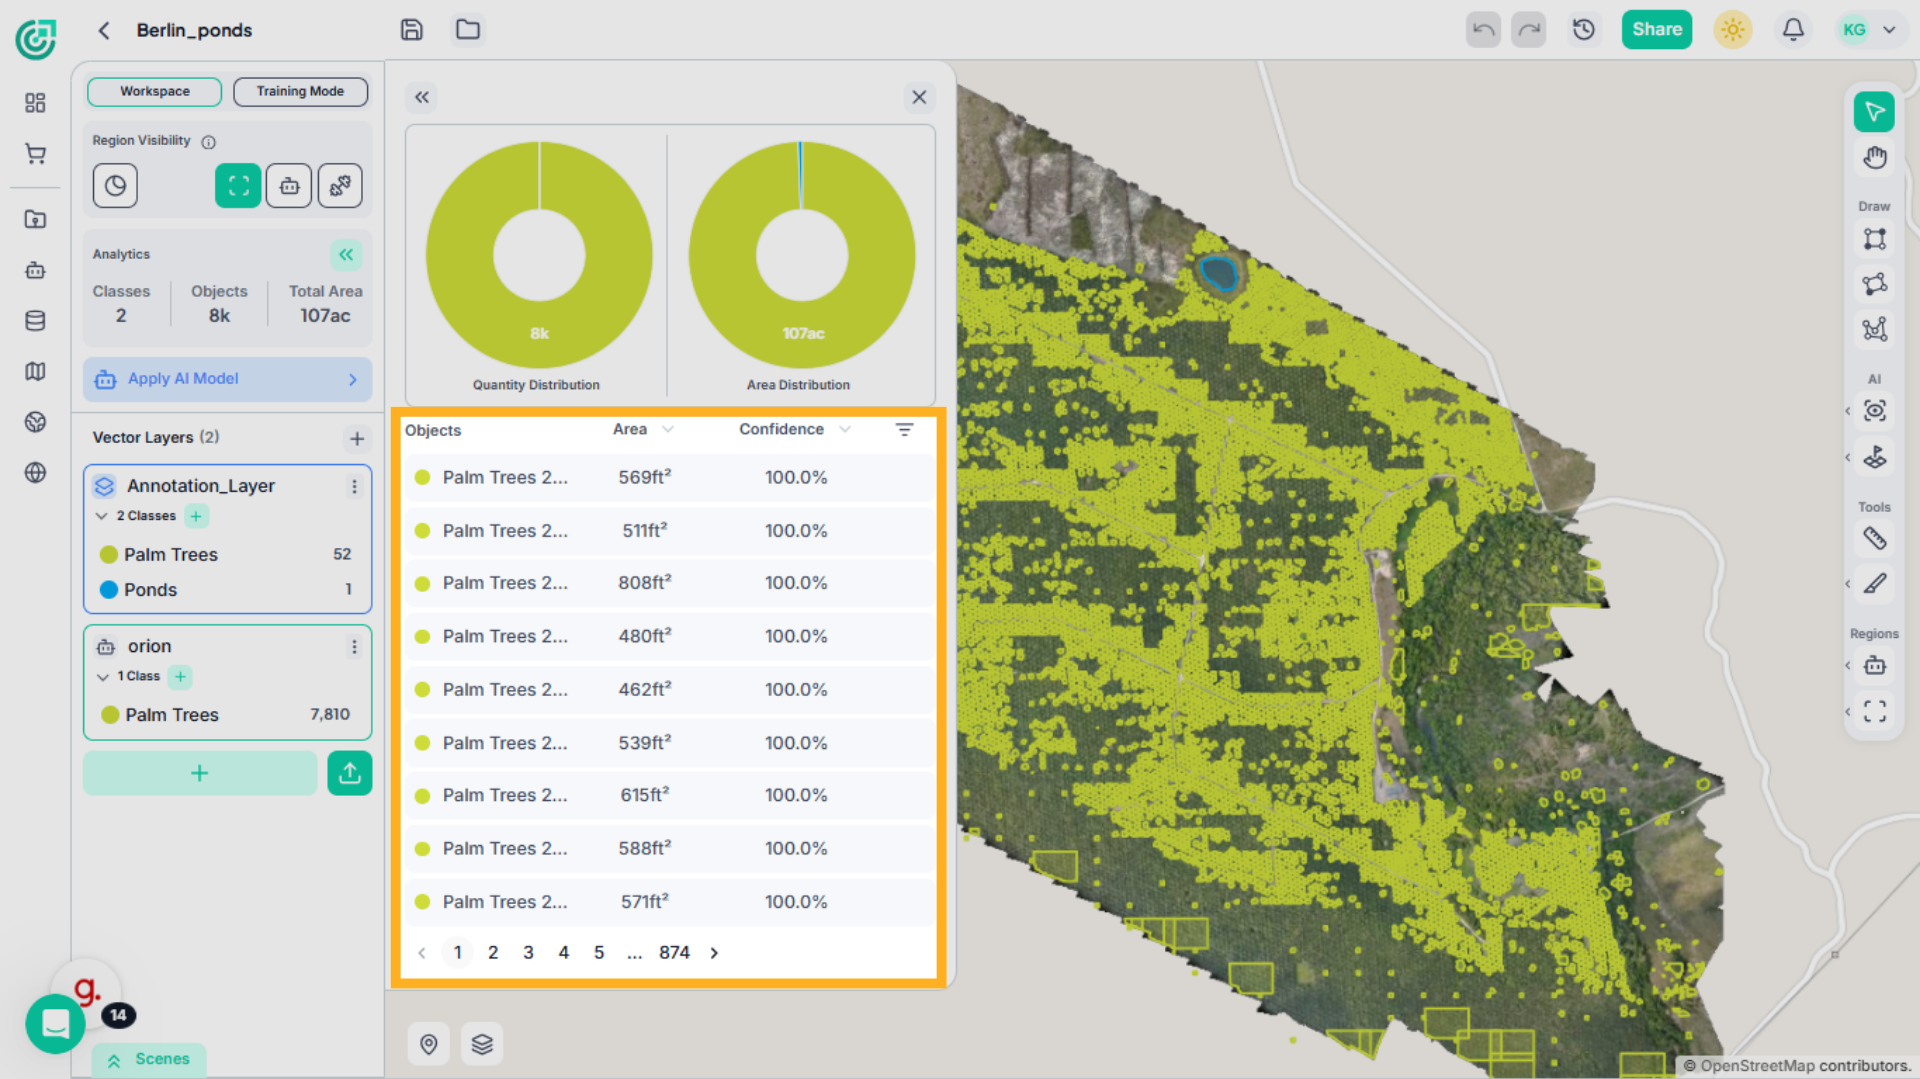
At the top of the panel, the Quantity Distribution chart shows the total number of detected objects across the workspace. If you want a quick overview of detection volume, this chart gives you an immediate summary.
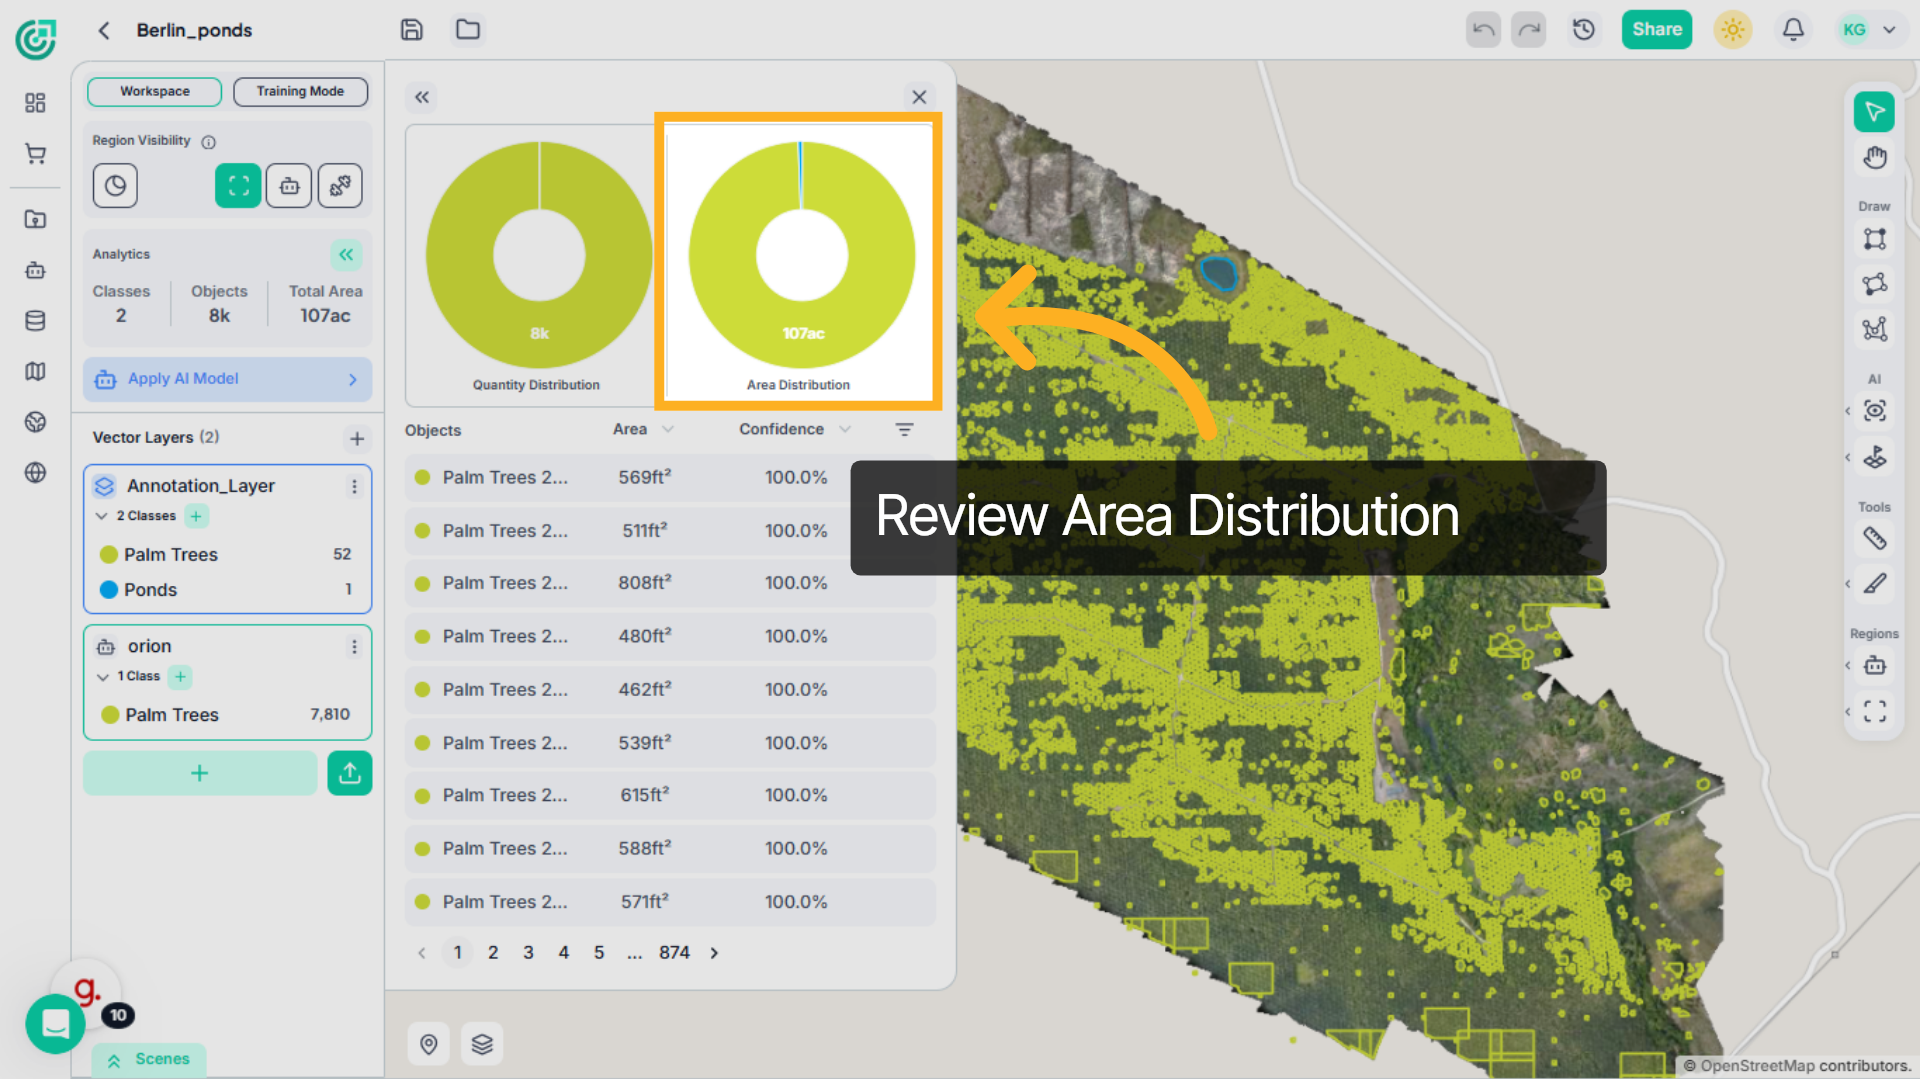
4. Review Area Distribution
Next to it, the Area Distribution chart displays the total surface area covered by detected objects. If you’re analyzing spatial coverage rather than just object count, this chart helps you understand how much area your detections occupy.
5. Browse Detected Objects
Below the charts, you’ll find a detailed table listing all detected objects. Each entry includes the object name, area measurement, and confidence score. If you need to explore the full dataset, you can scroll through the list or navigate across pages.
6. Sort by Area
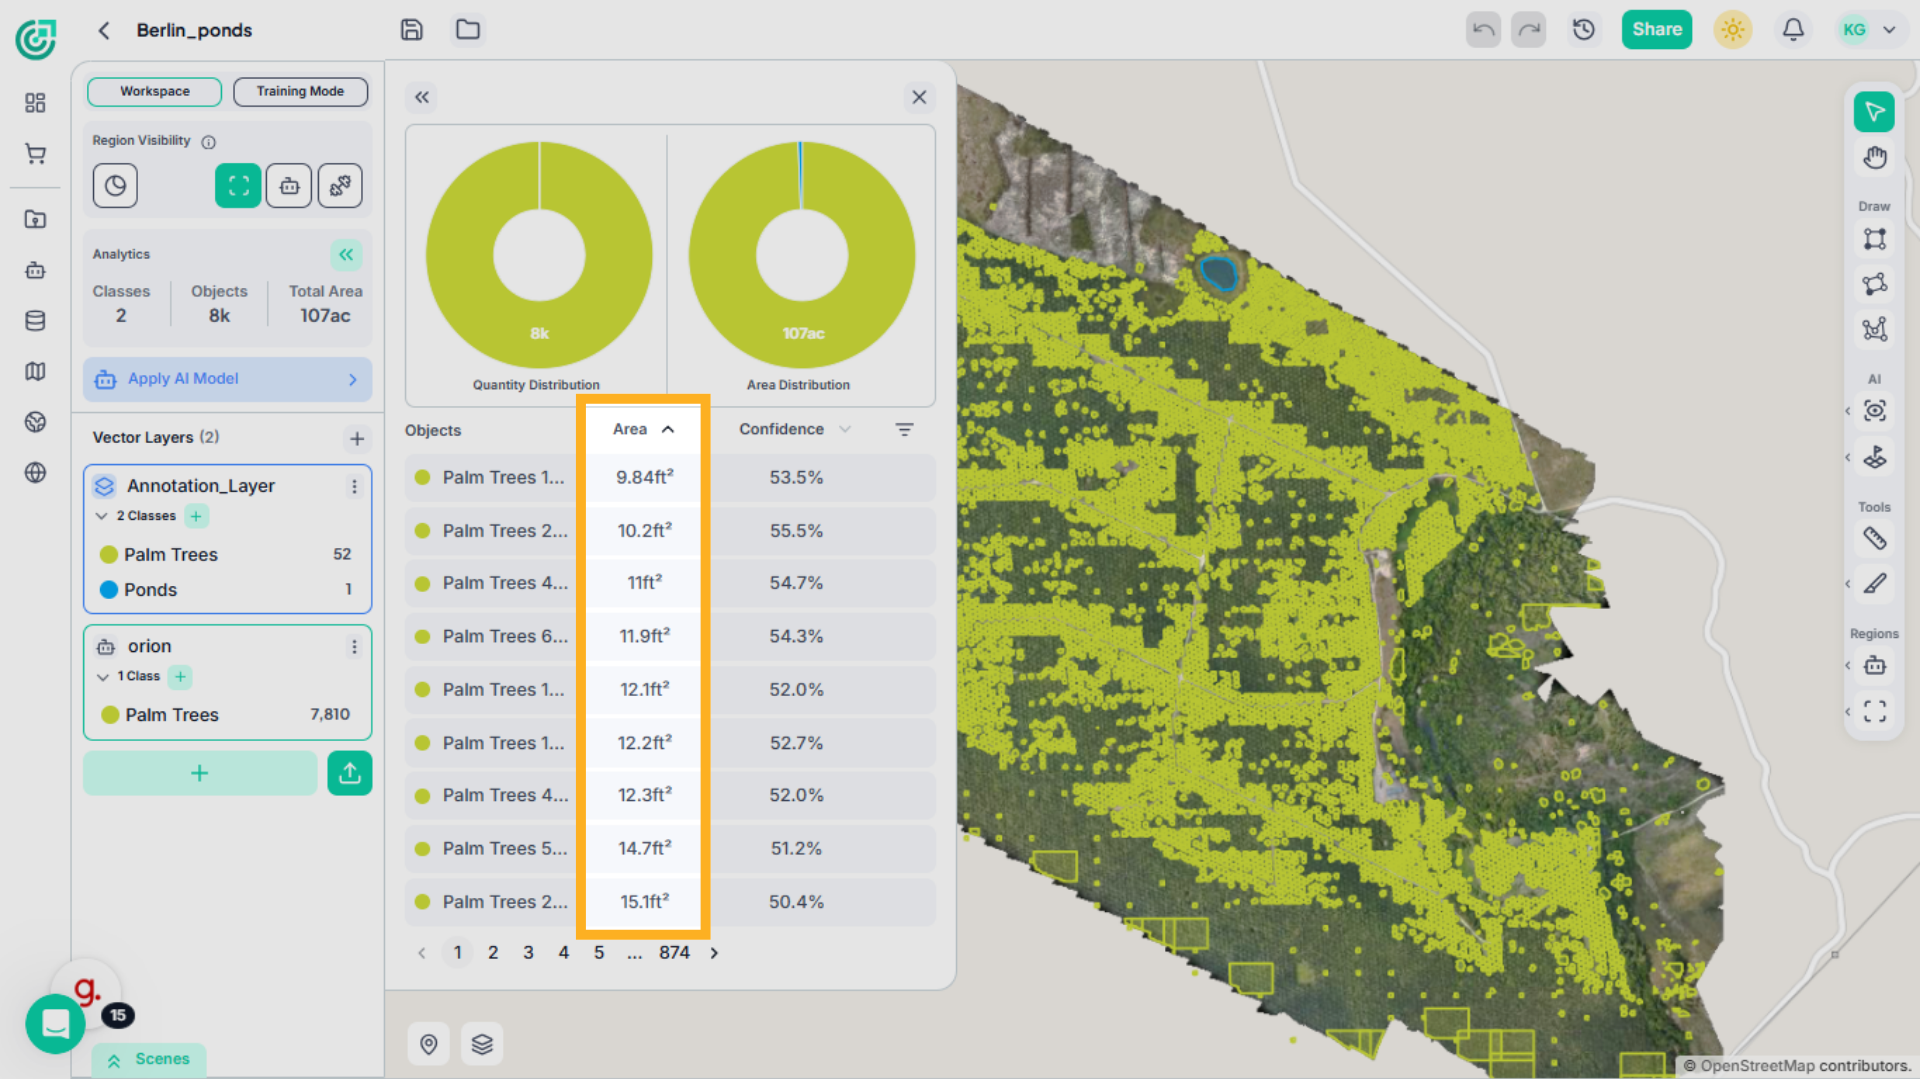
If you want to quickly identify the largest or smallest detections, click to sort the table by Area.

7. Review Sorted Areas
Once sorted, the list reorganizes based on size. This makes it easier to spot unusually large detections or very small objects that may require attention.
8. Sort by Confidence Score
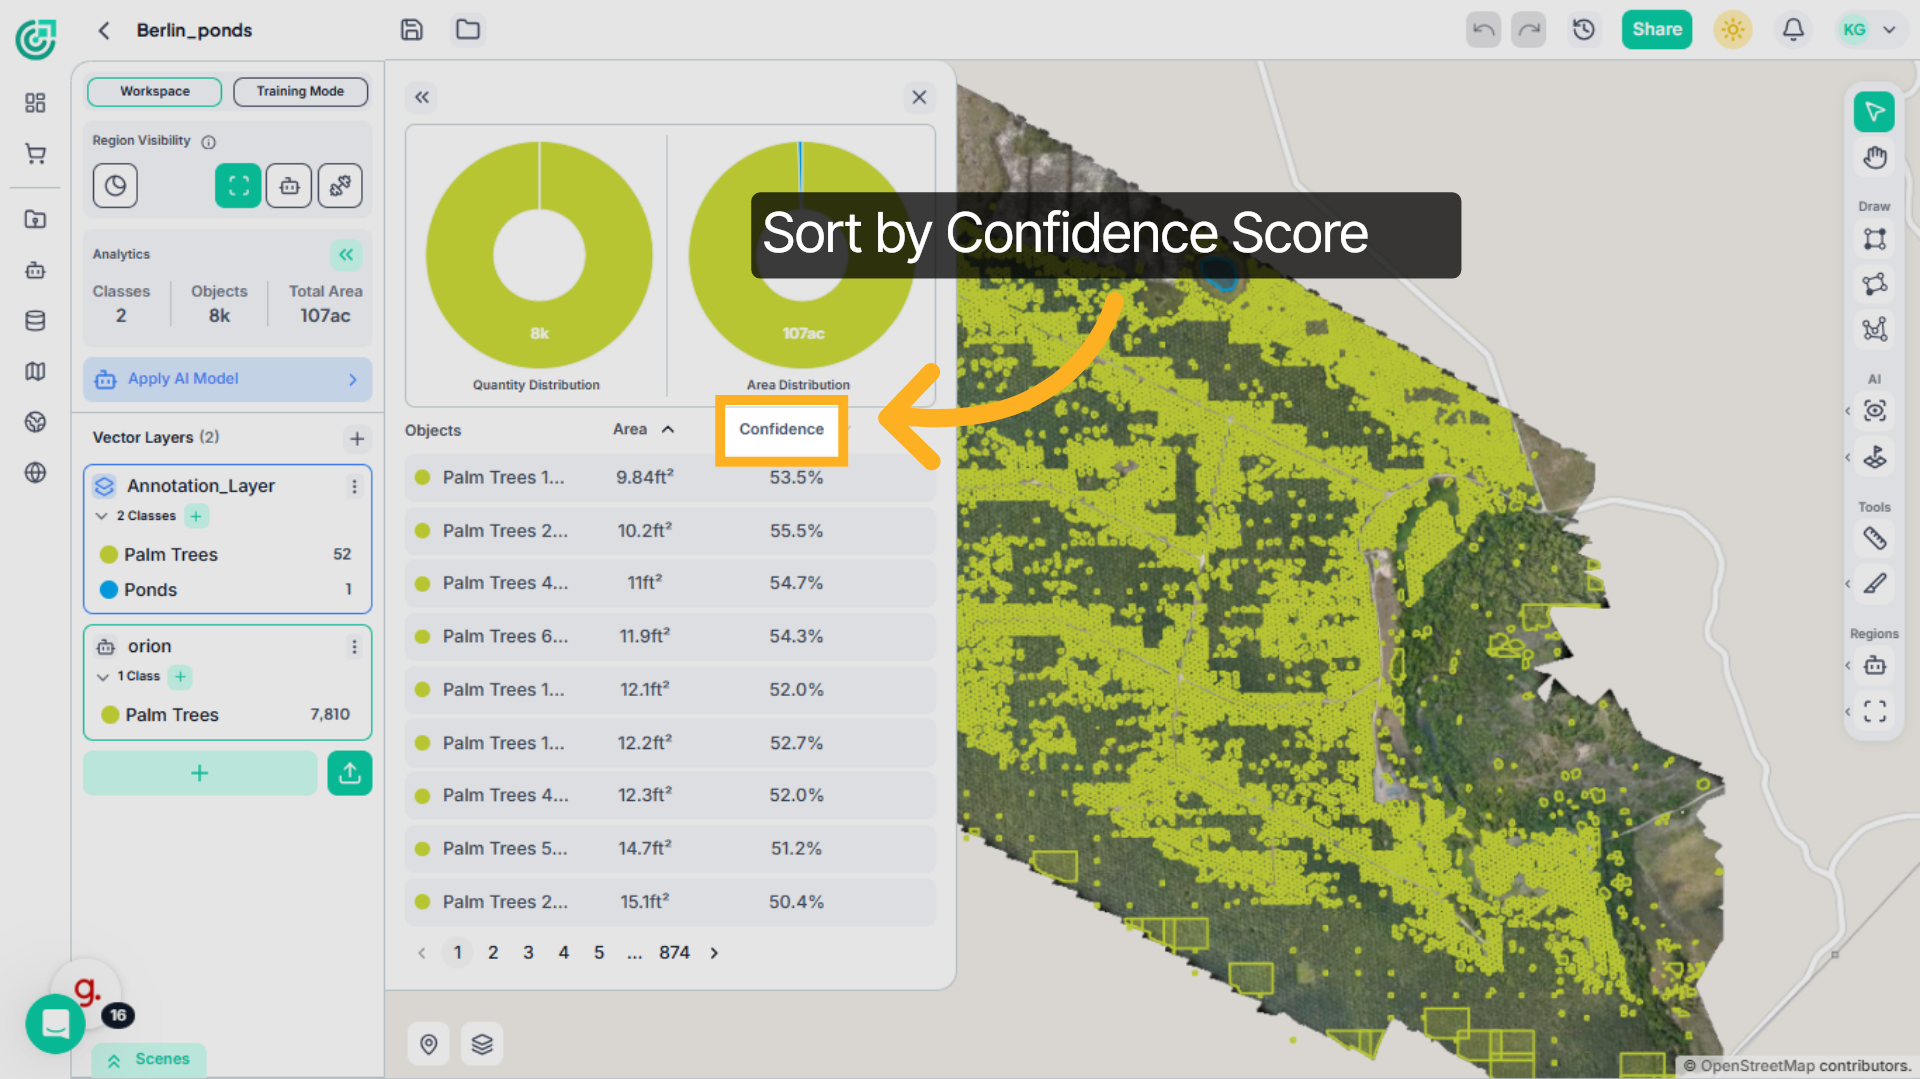
If you’d like to evaluate detection reliability, sort the table by Confidence Score.
9. Review Sorted Confidence scores
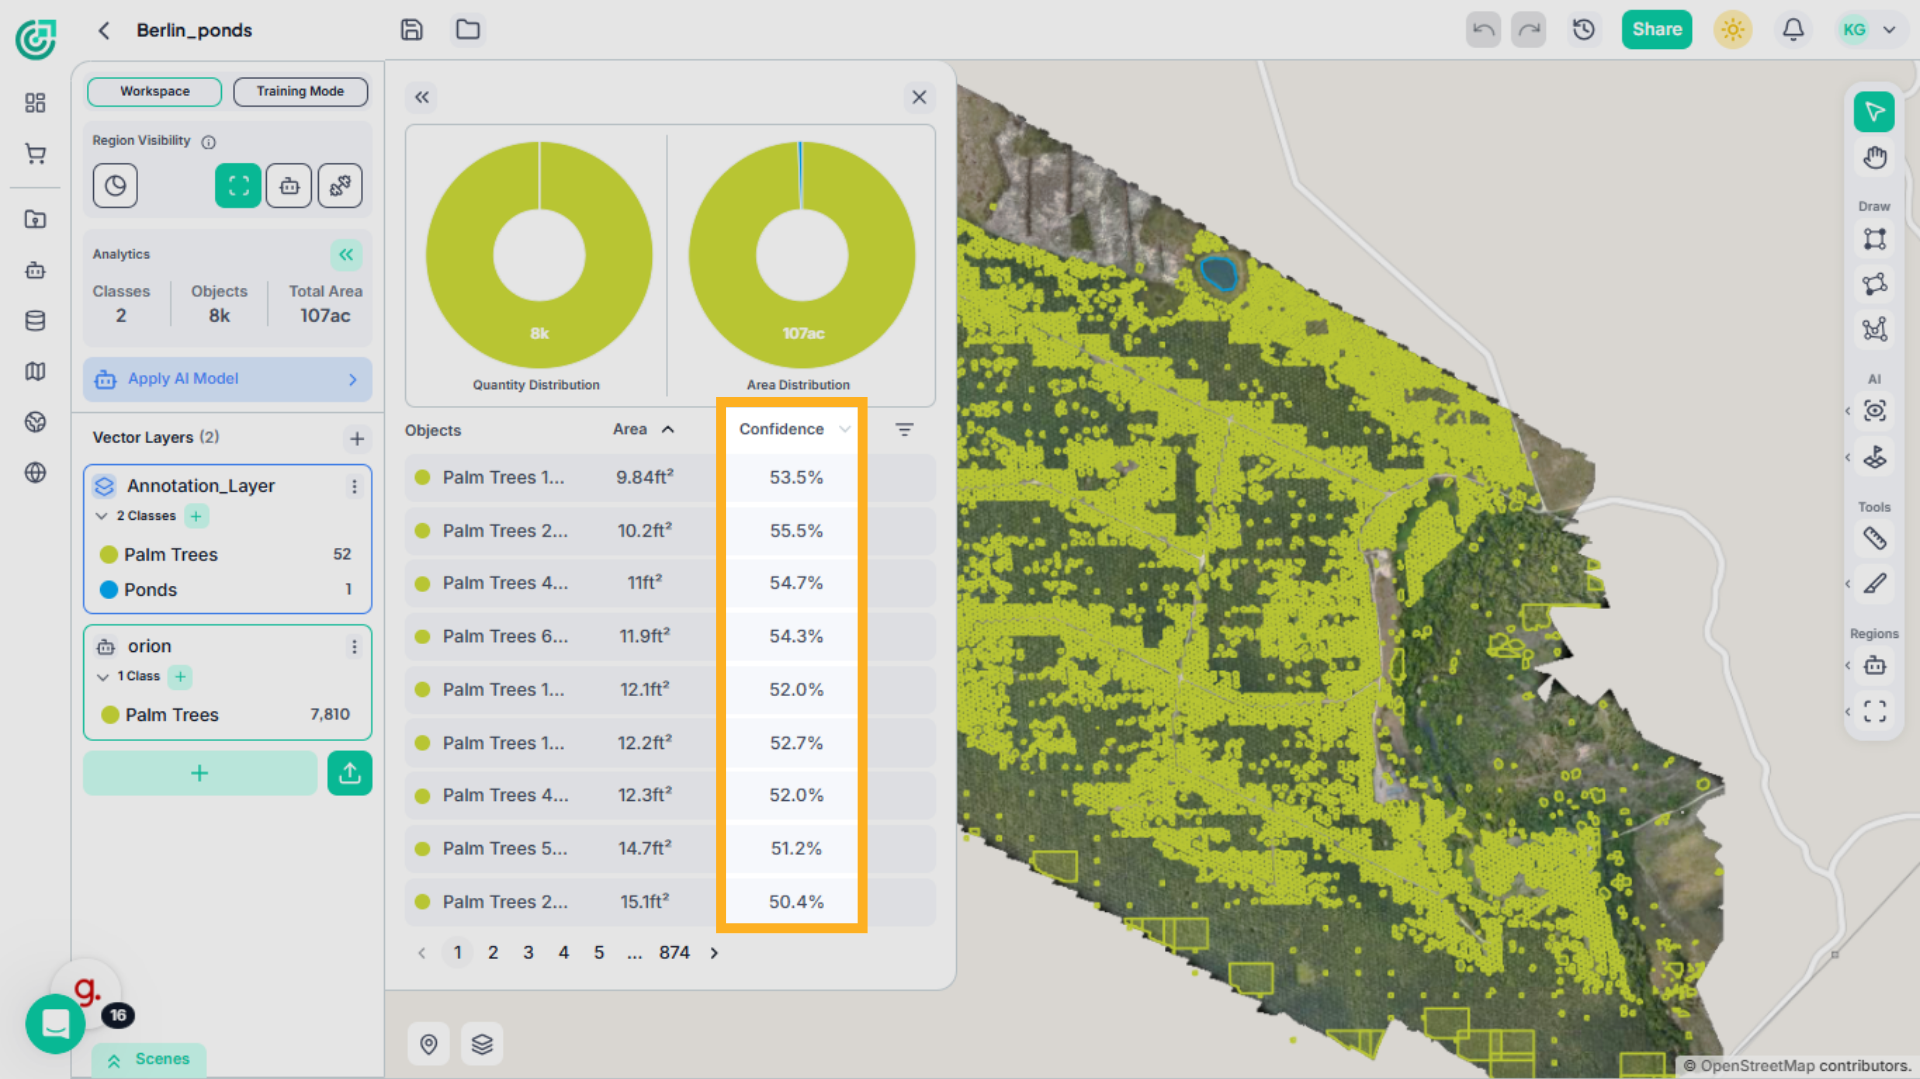
This allows you to focus on lower-confidence detections that may require validation, or verify highly confident results.
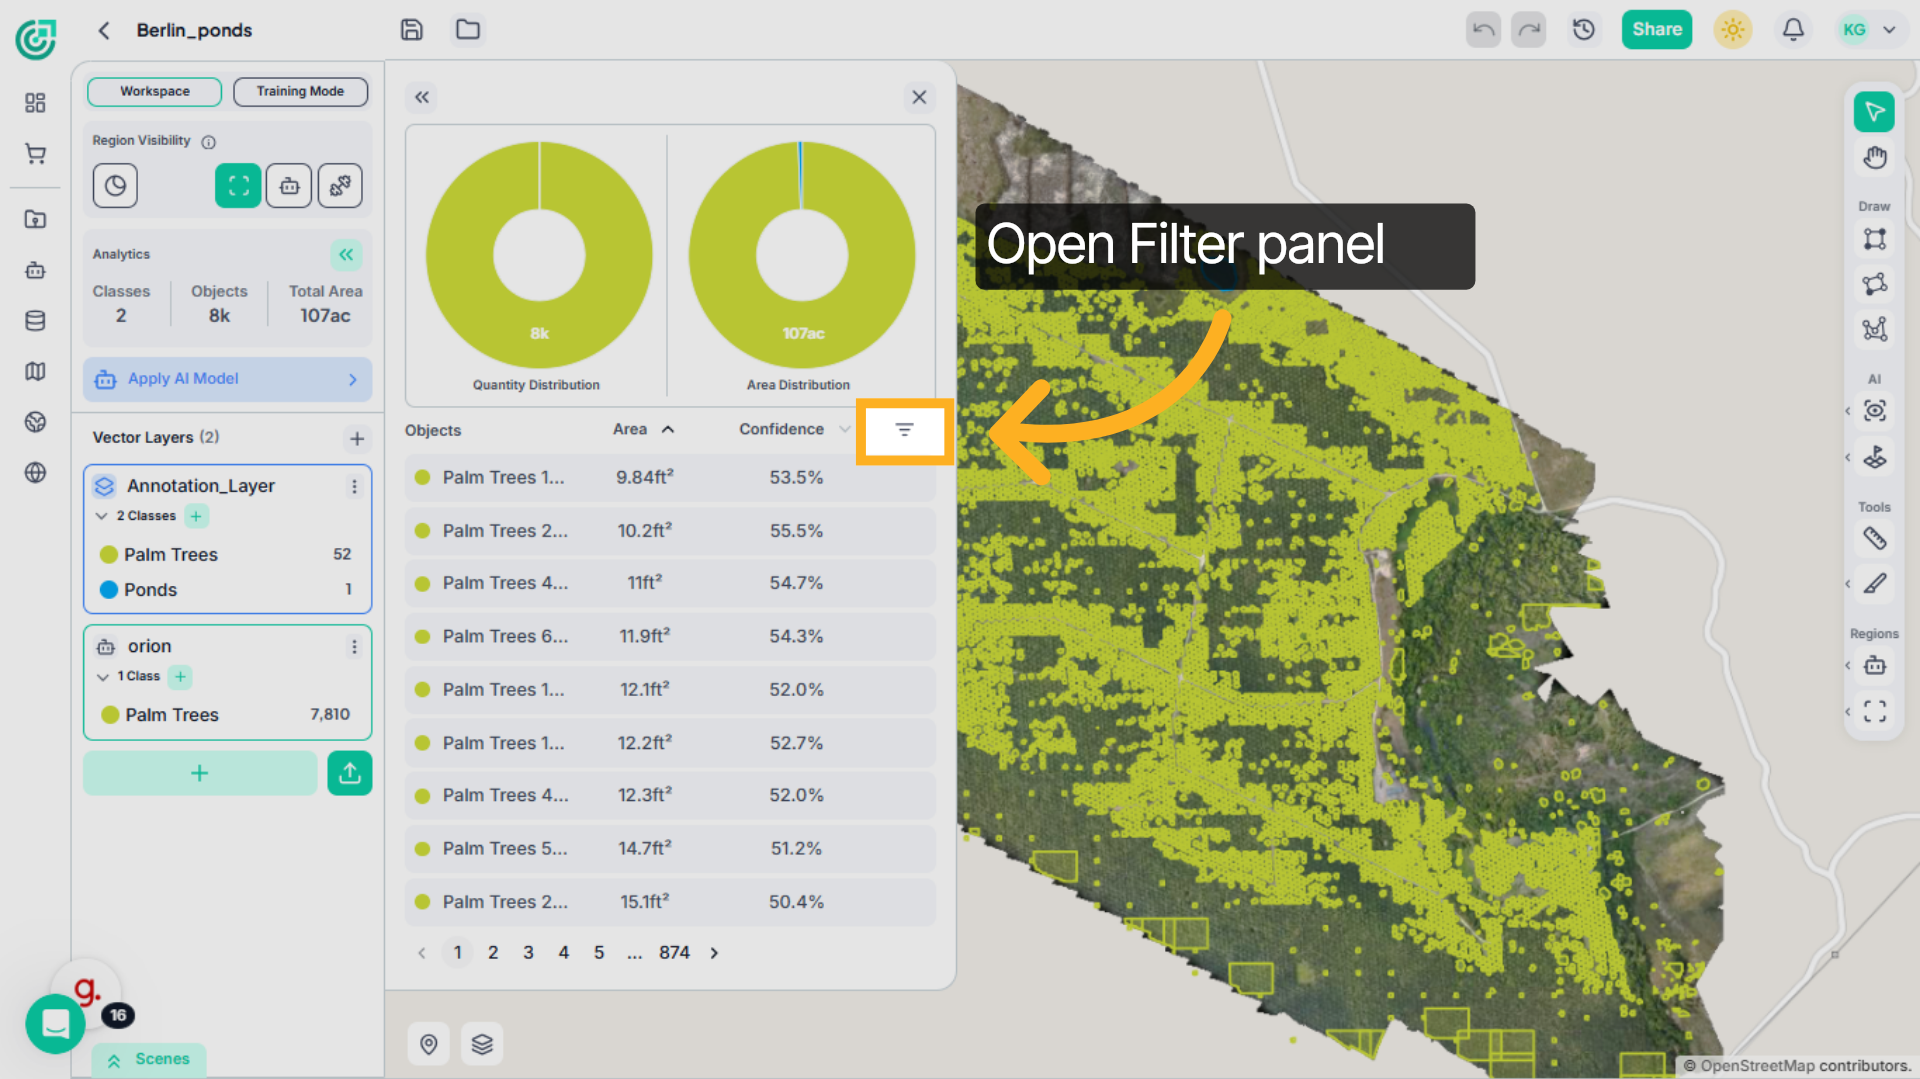
10. Open Filter Panel
If you need more precise control, expand the Filter section. This allows you to refine detections using specific measurement ranges.
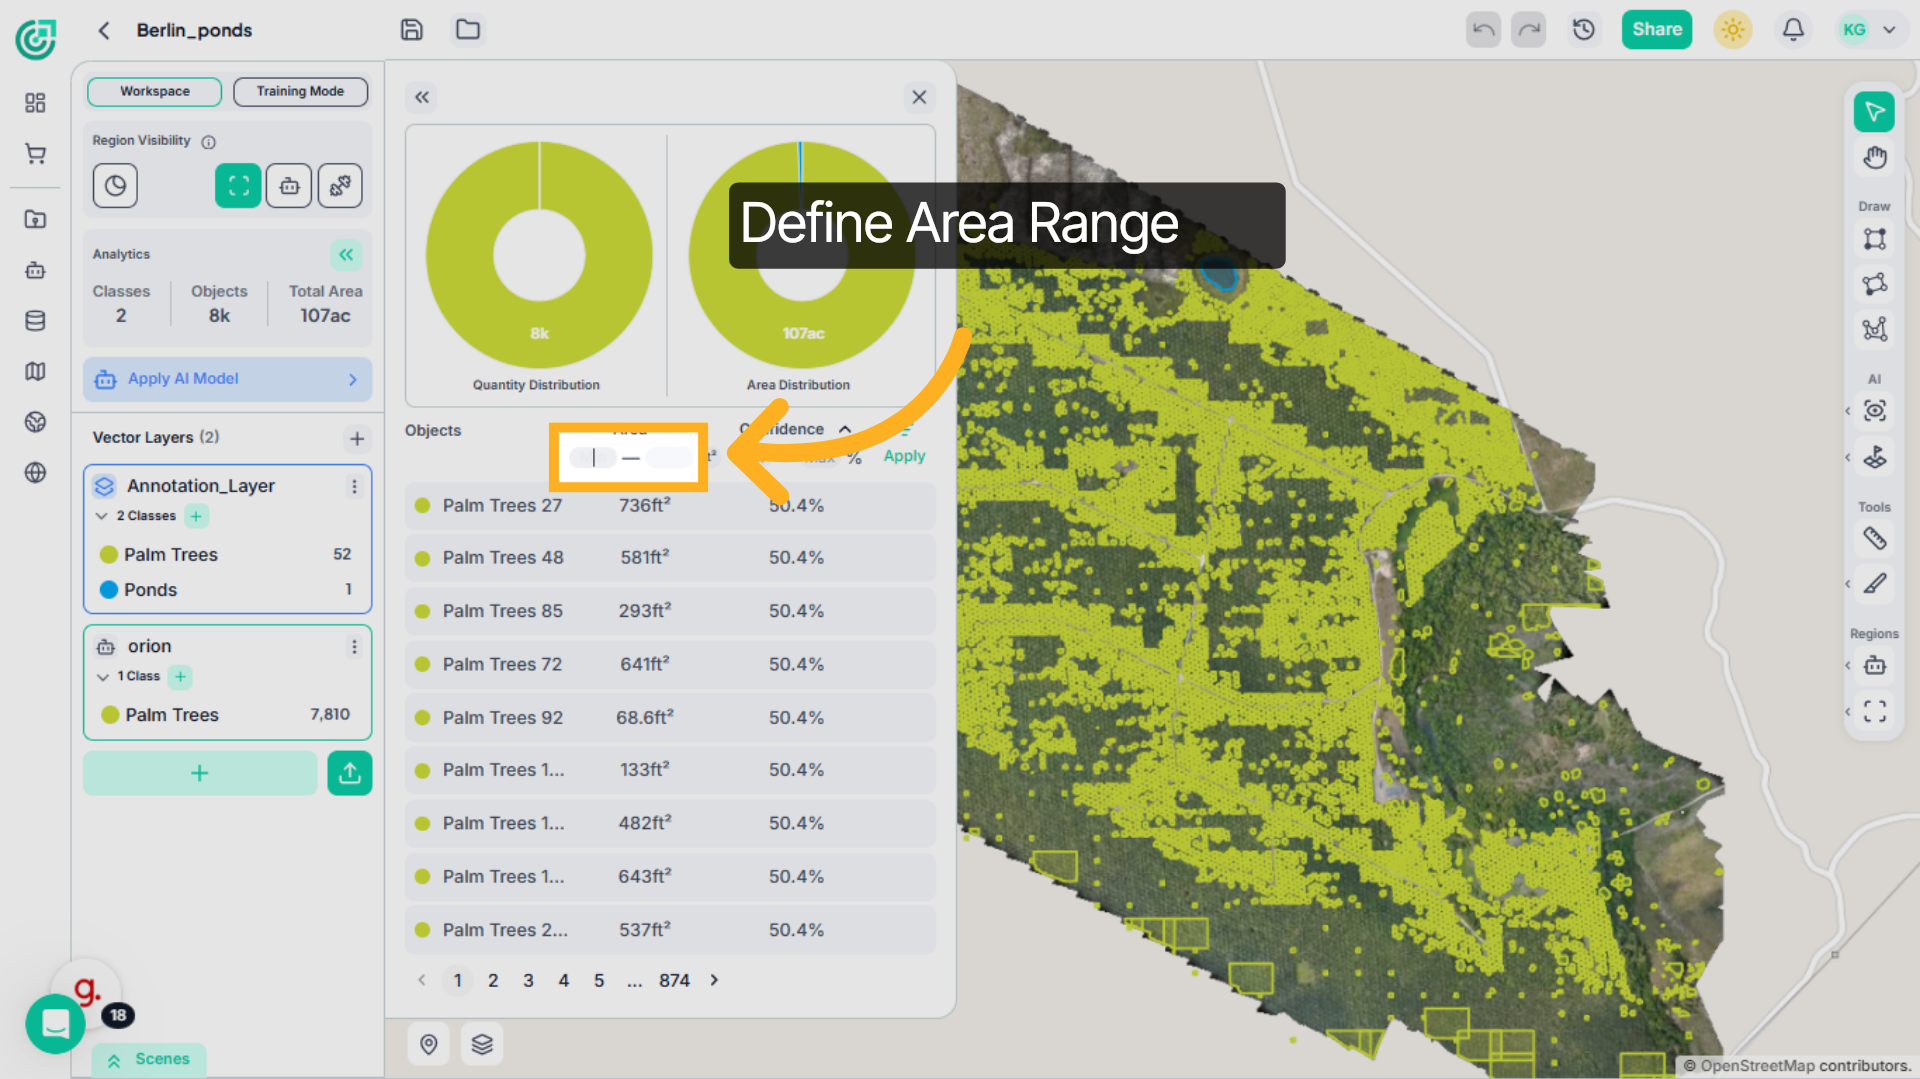
11. Define Area Range
You can set a minimum and maximum area range, for example, 100 to 1000 to filter objects based on size. This allows you to quickly narrow down detections to specific size categories.
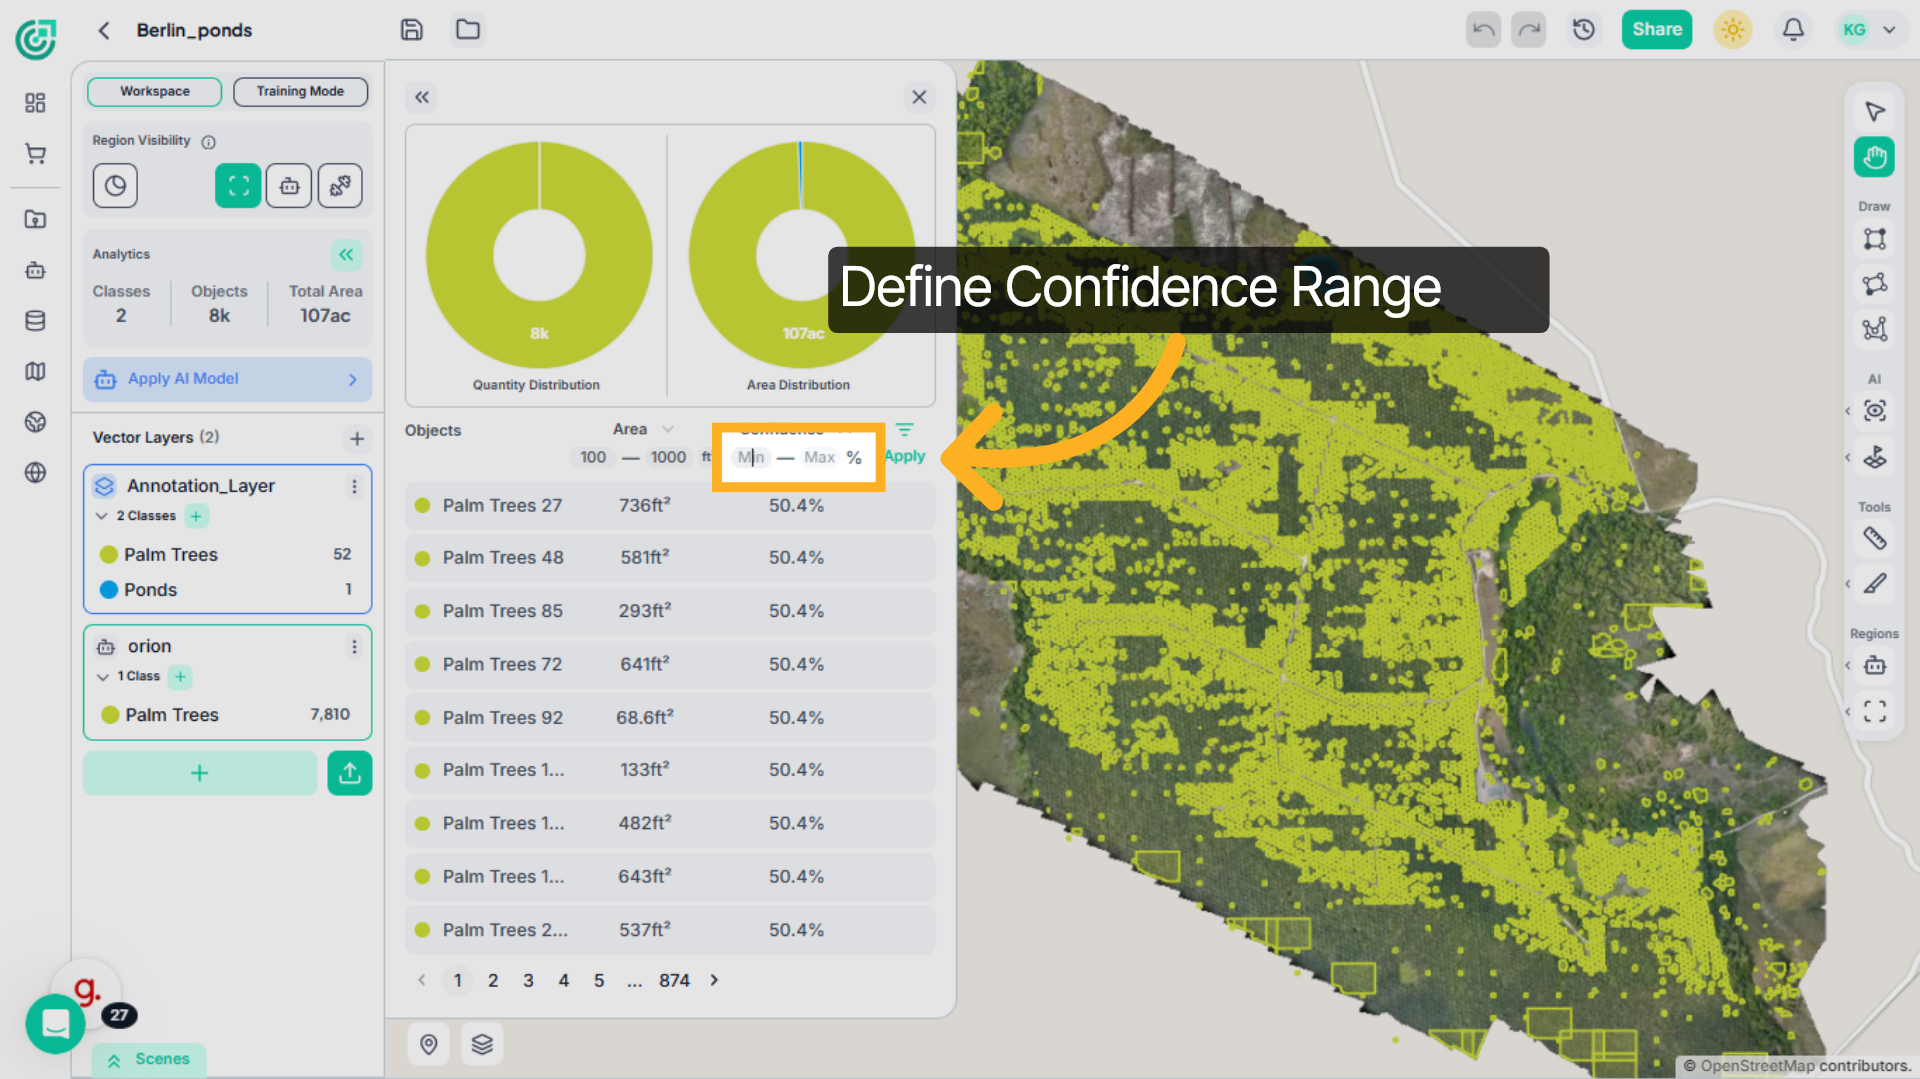
12. Define Confidence Range
You can adjust the confidence threshold by defining minimum and maximum values. This helps you focus on high-certainty detections or review lower-confidence results that may require validation.
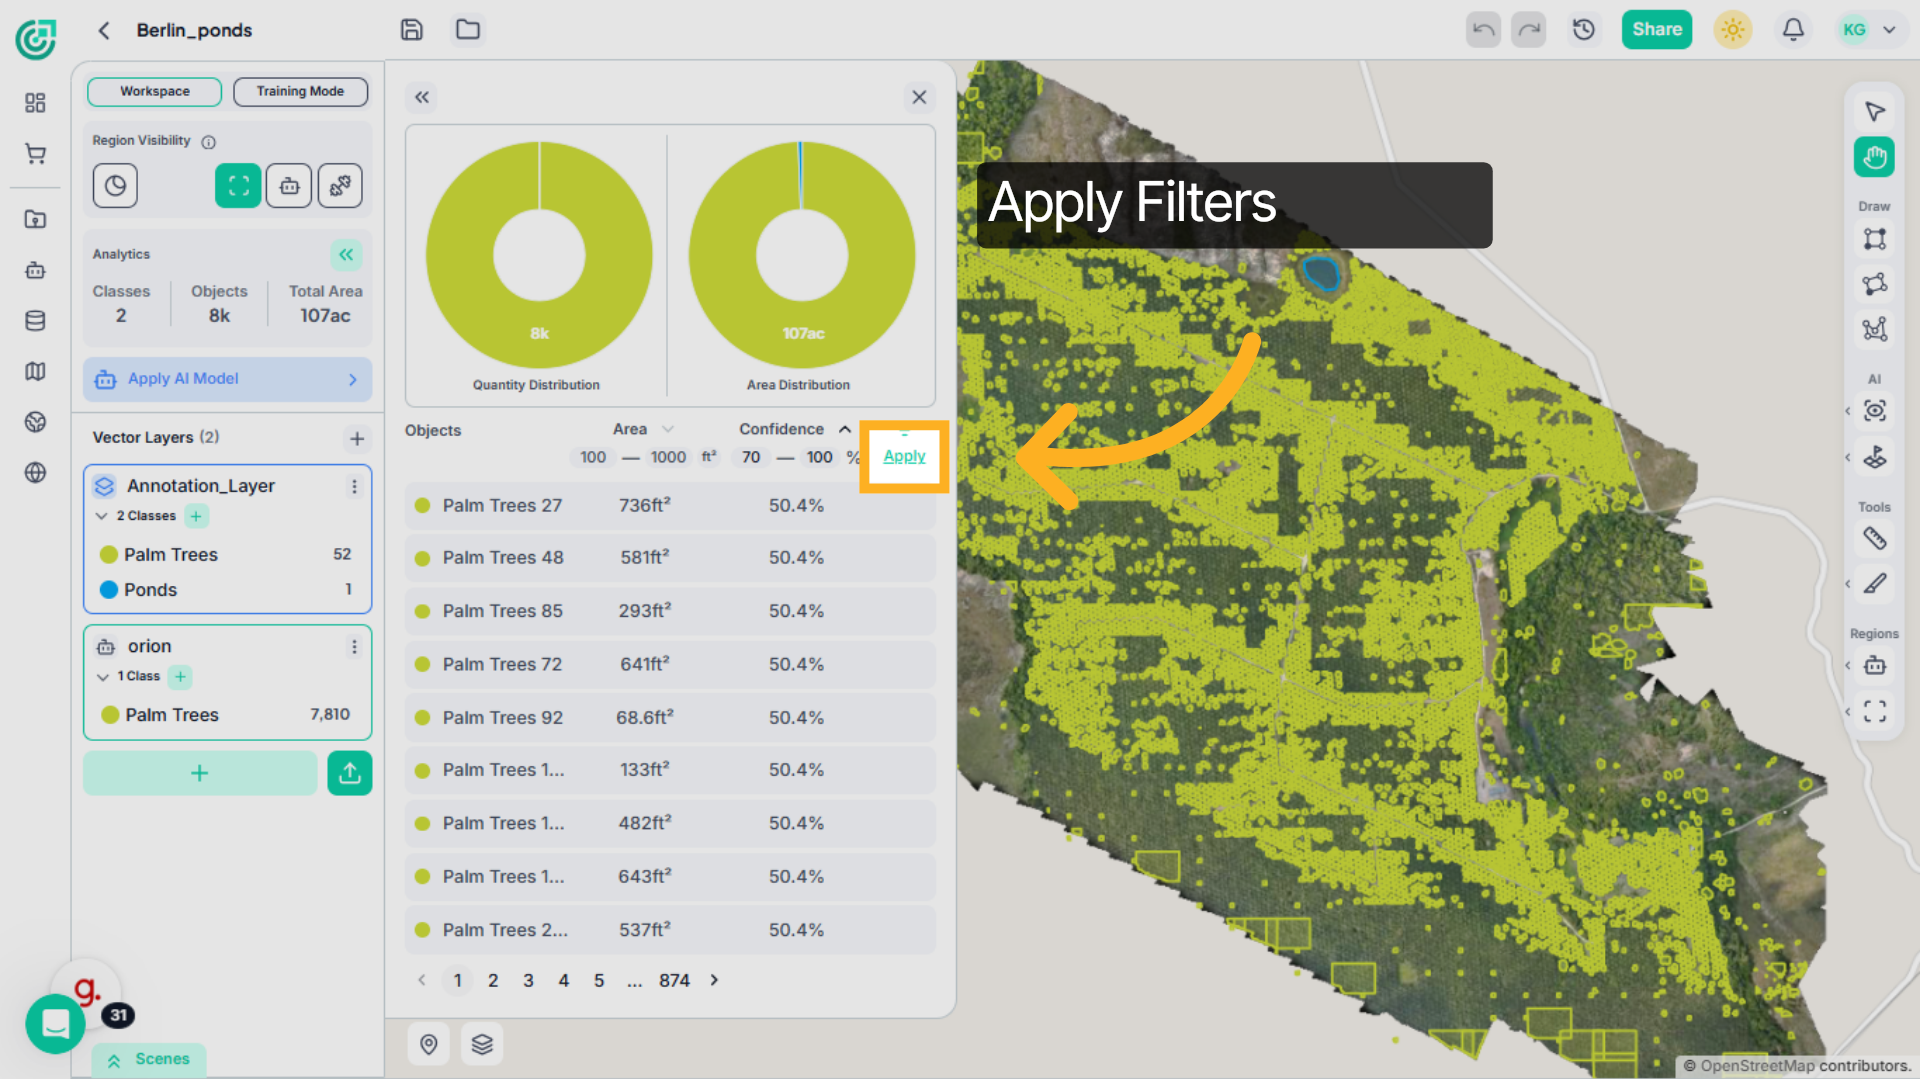
13. Apply Filters
Once you apply the filters, the table automatically updates to display only the objects that match your selected criteria.
14. Interact with Filtered Results
You can select any object from the filtered list to highlight it directly on the map. The workspace automatically navigates to its exact location, allowing you to inspect it within the imagery.
You’ve now seen how to use the Analytical Panel to review object distributions, sort detections, and apply targeted filters. By combining sorting, filtering, and interactive map highlighting, you can efficiently analyze and validate detection results within the workspace.