Explore Map Workspace Features in FlyPix AI
This demo showcases how to effectively use the Map Workspace in FlyPix AI to manage and analyze geospatial data.
Go to app.flypix.ai
1. Introduction
In this demo, we’ll explore how to navigate the Map Workspace and customize raster visualization for accurate geospatial analysis.
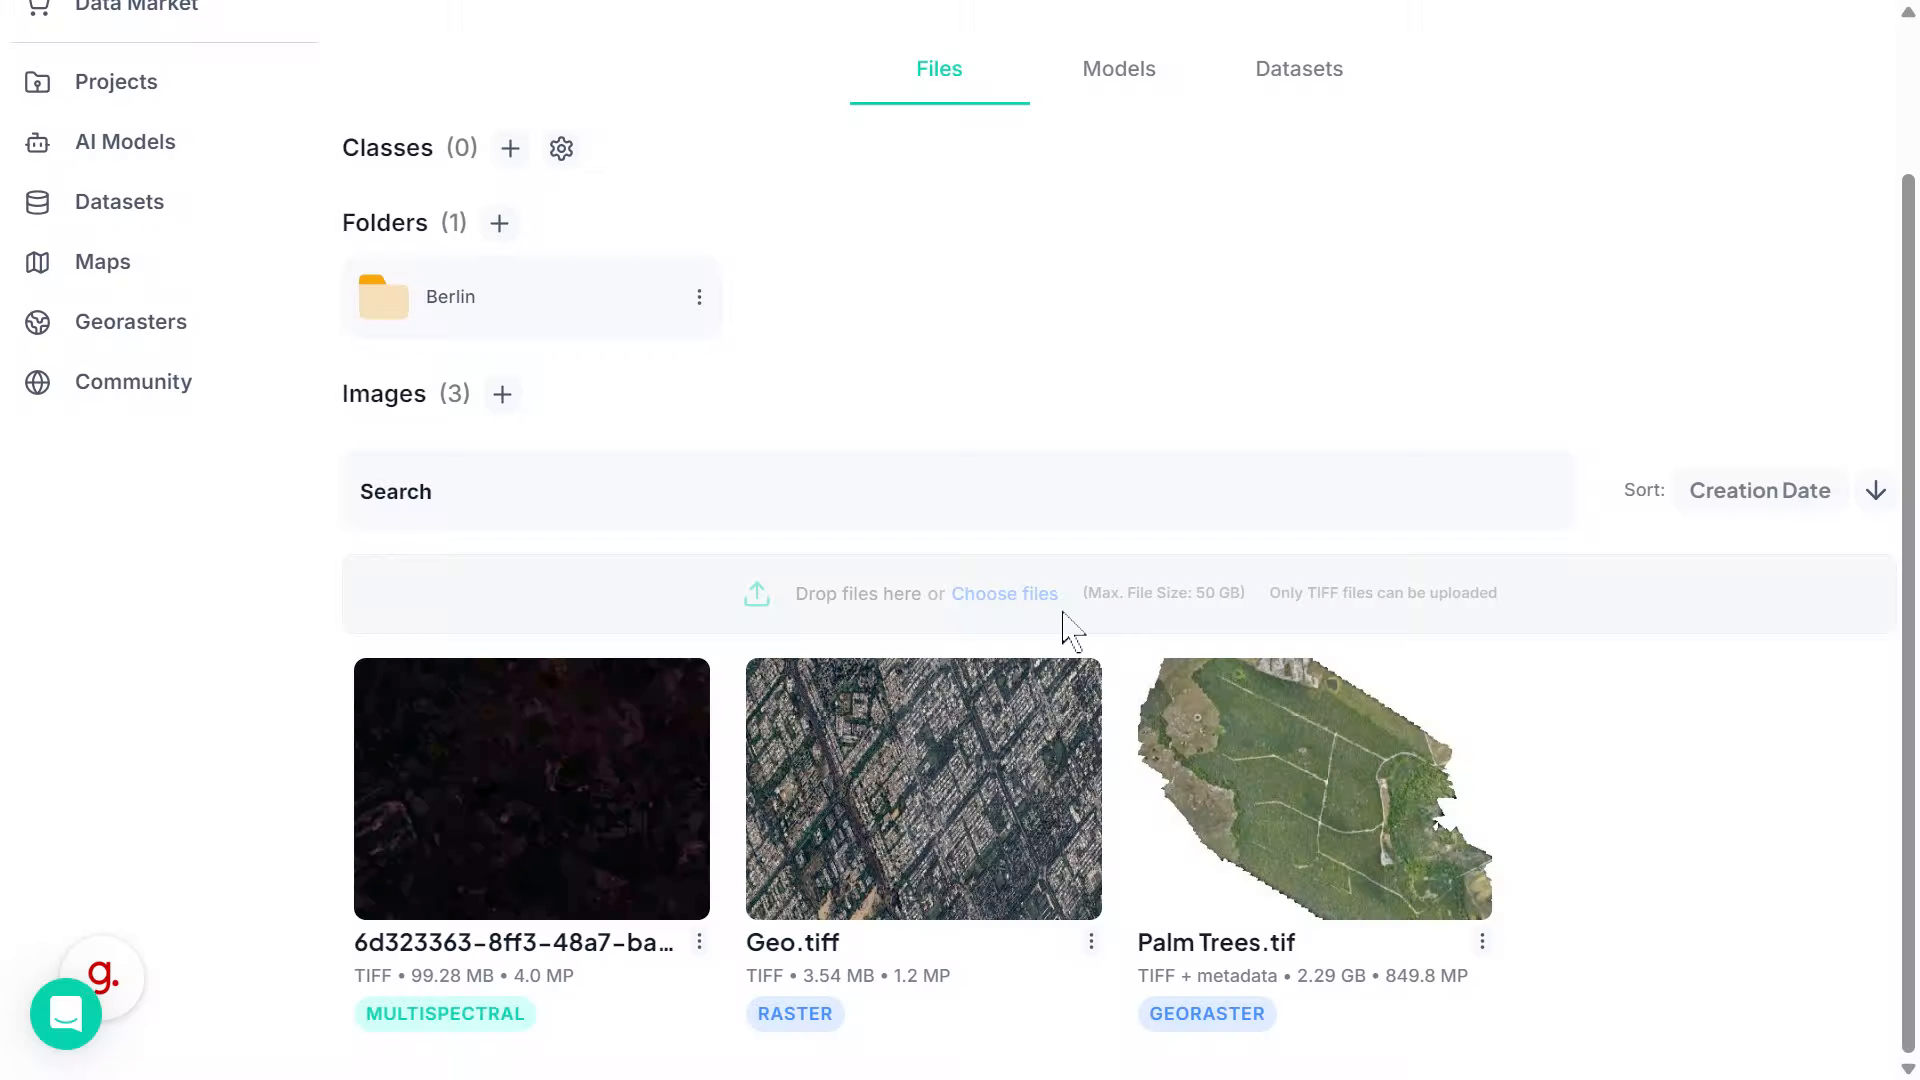
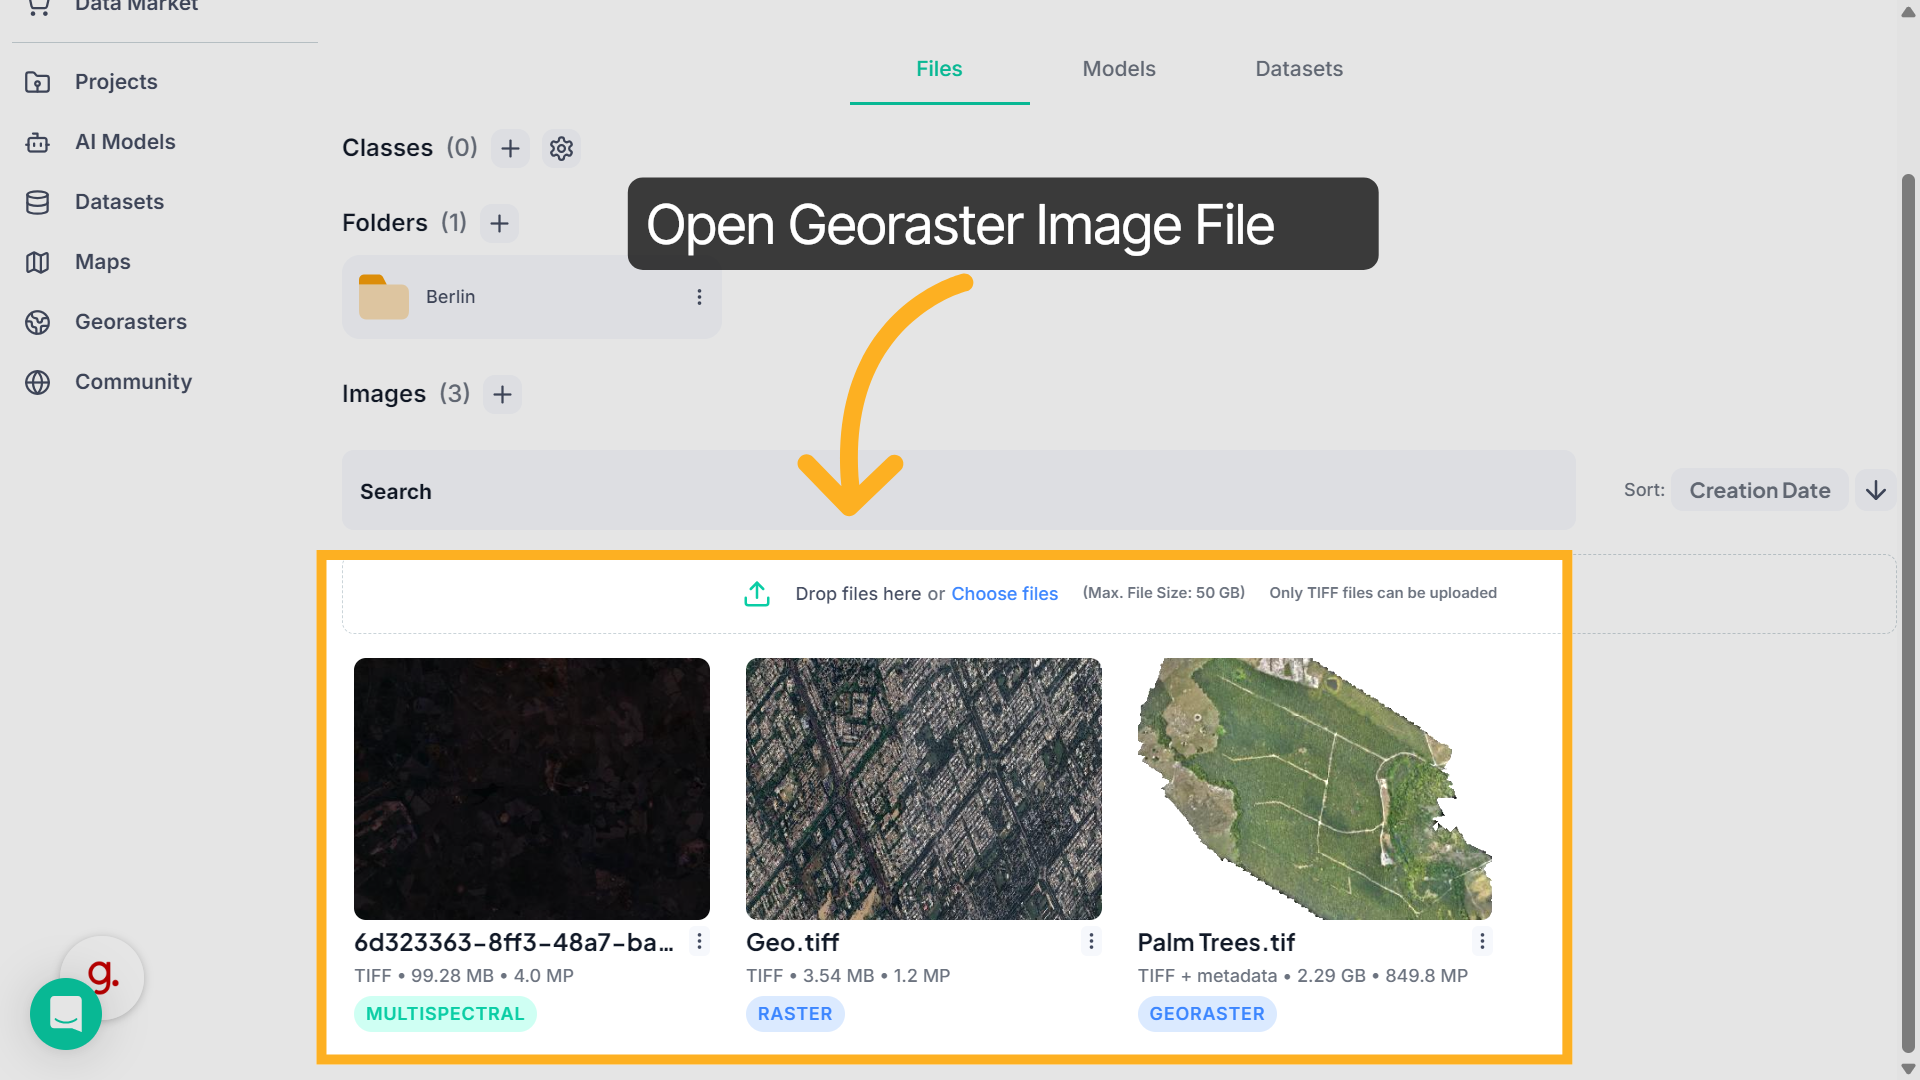
2. Open the Workspace
Start by opening your dataset from the Georasters section.
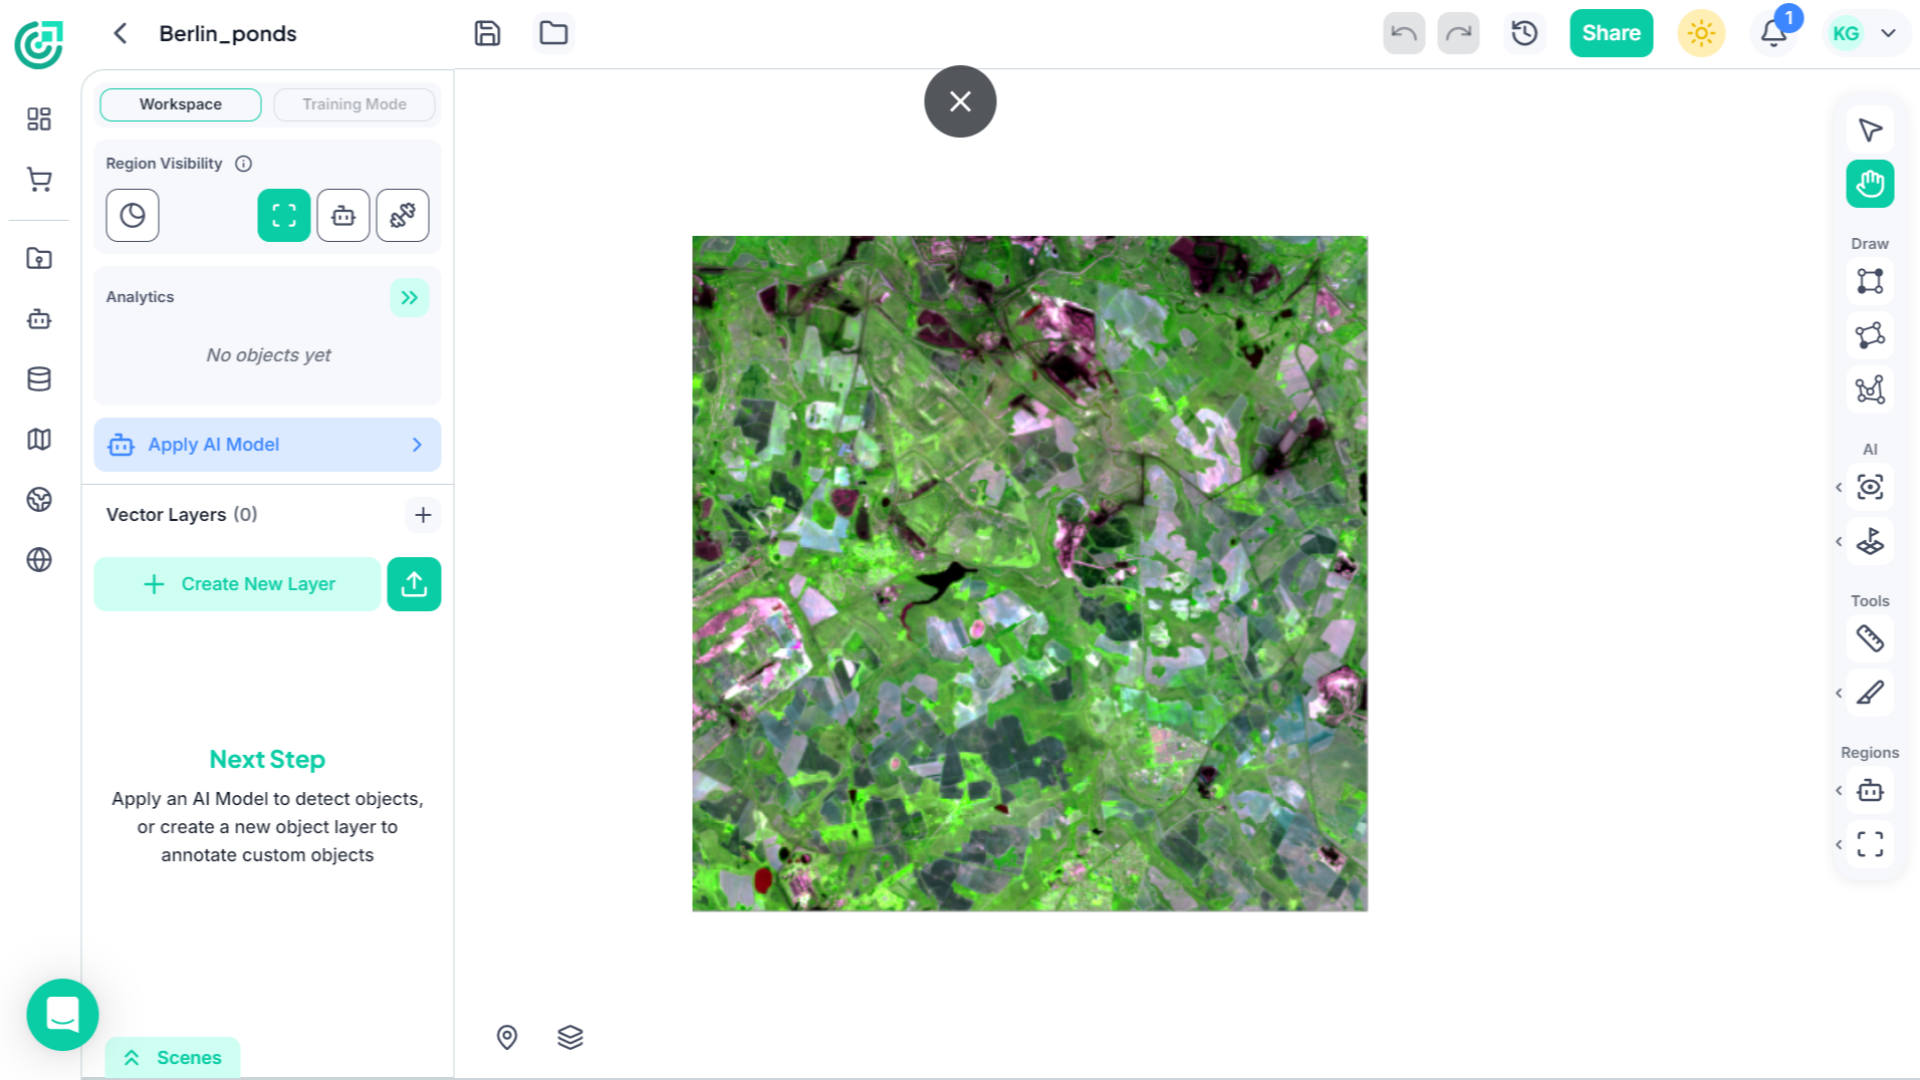
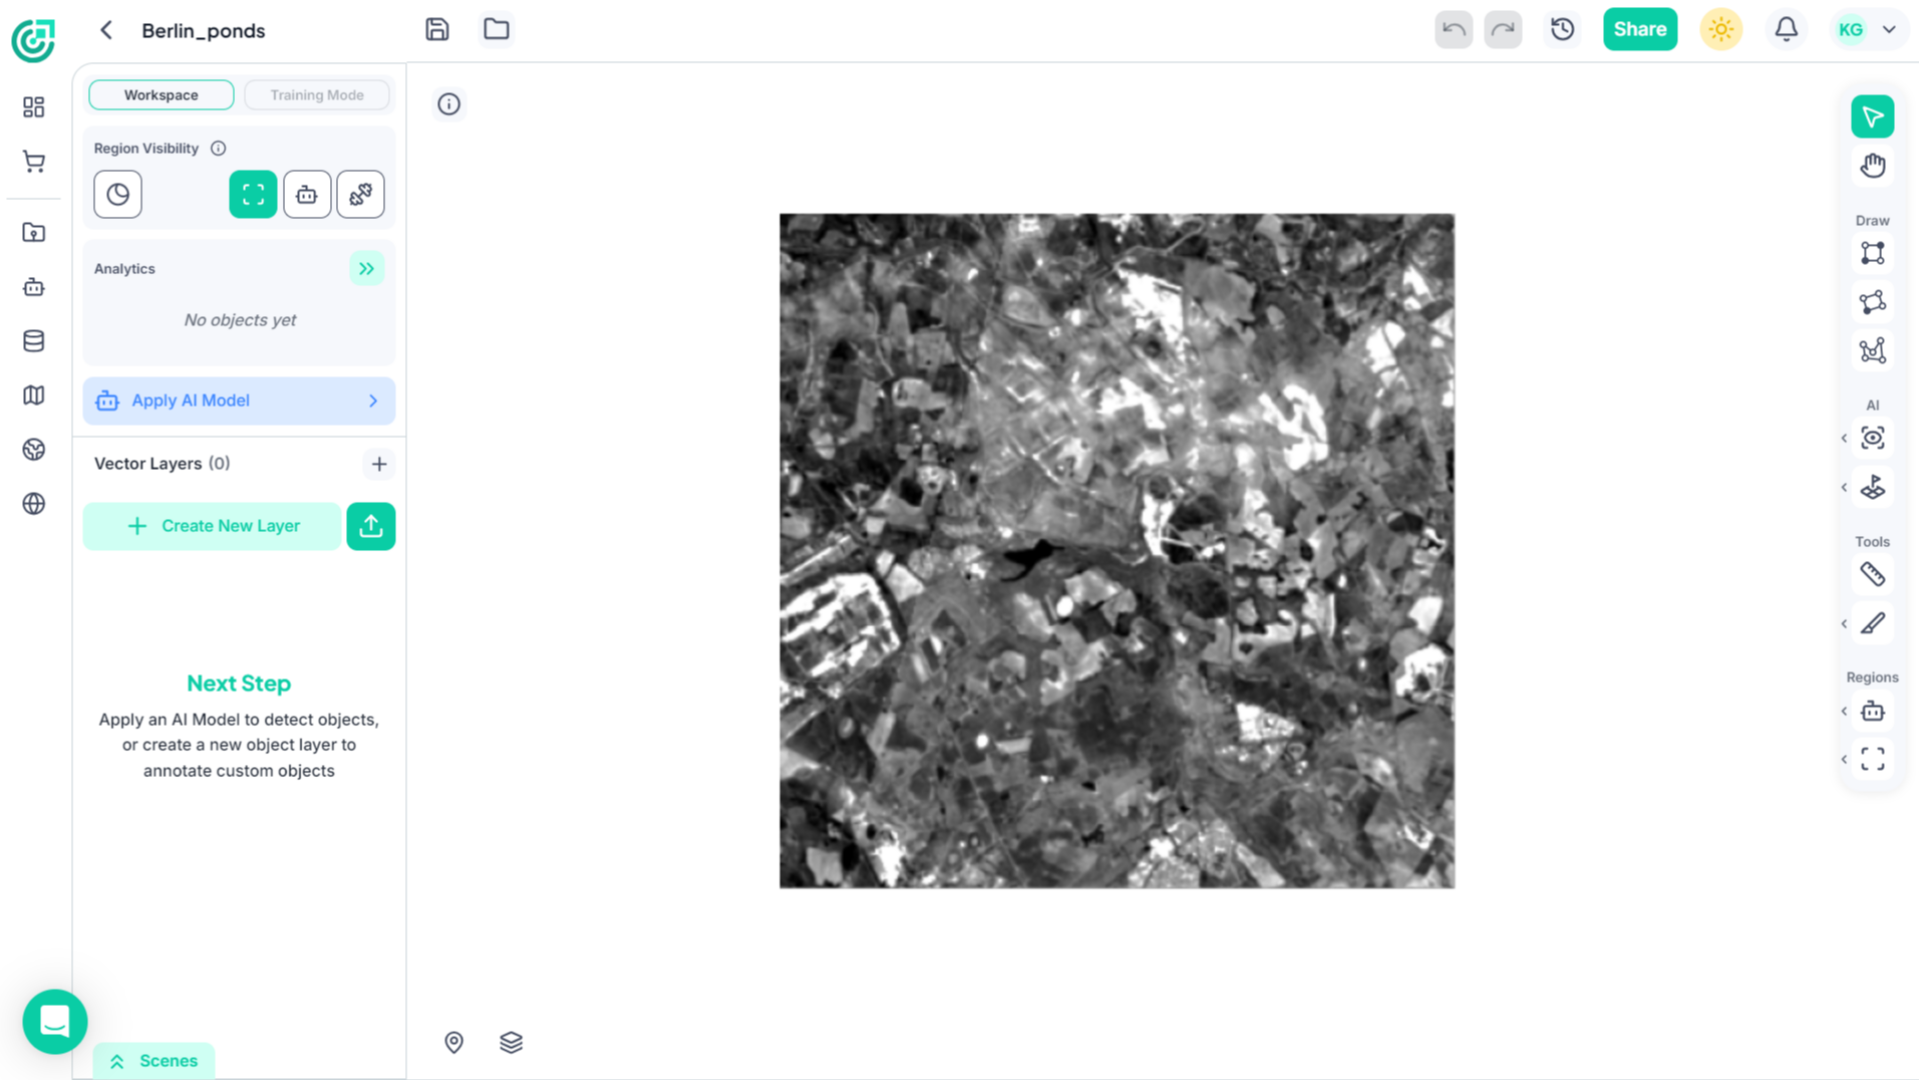
3. Opened Workspace
This loads your imagery into the Map Workspace, where you can interact directly with spatial data.
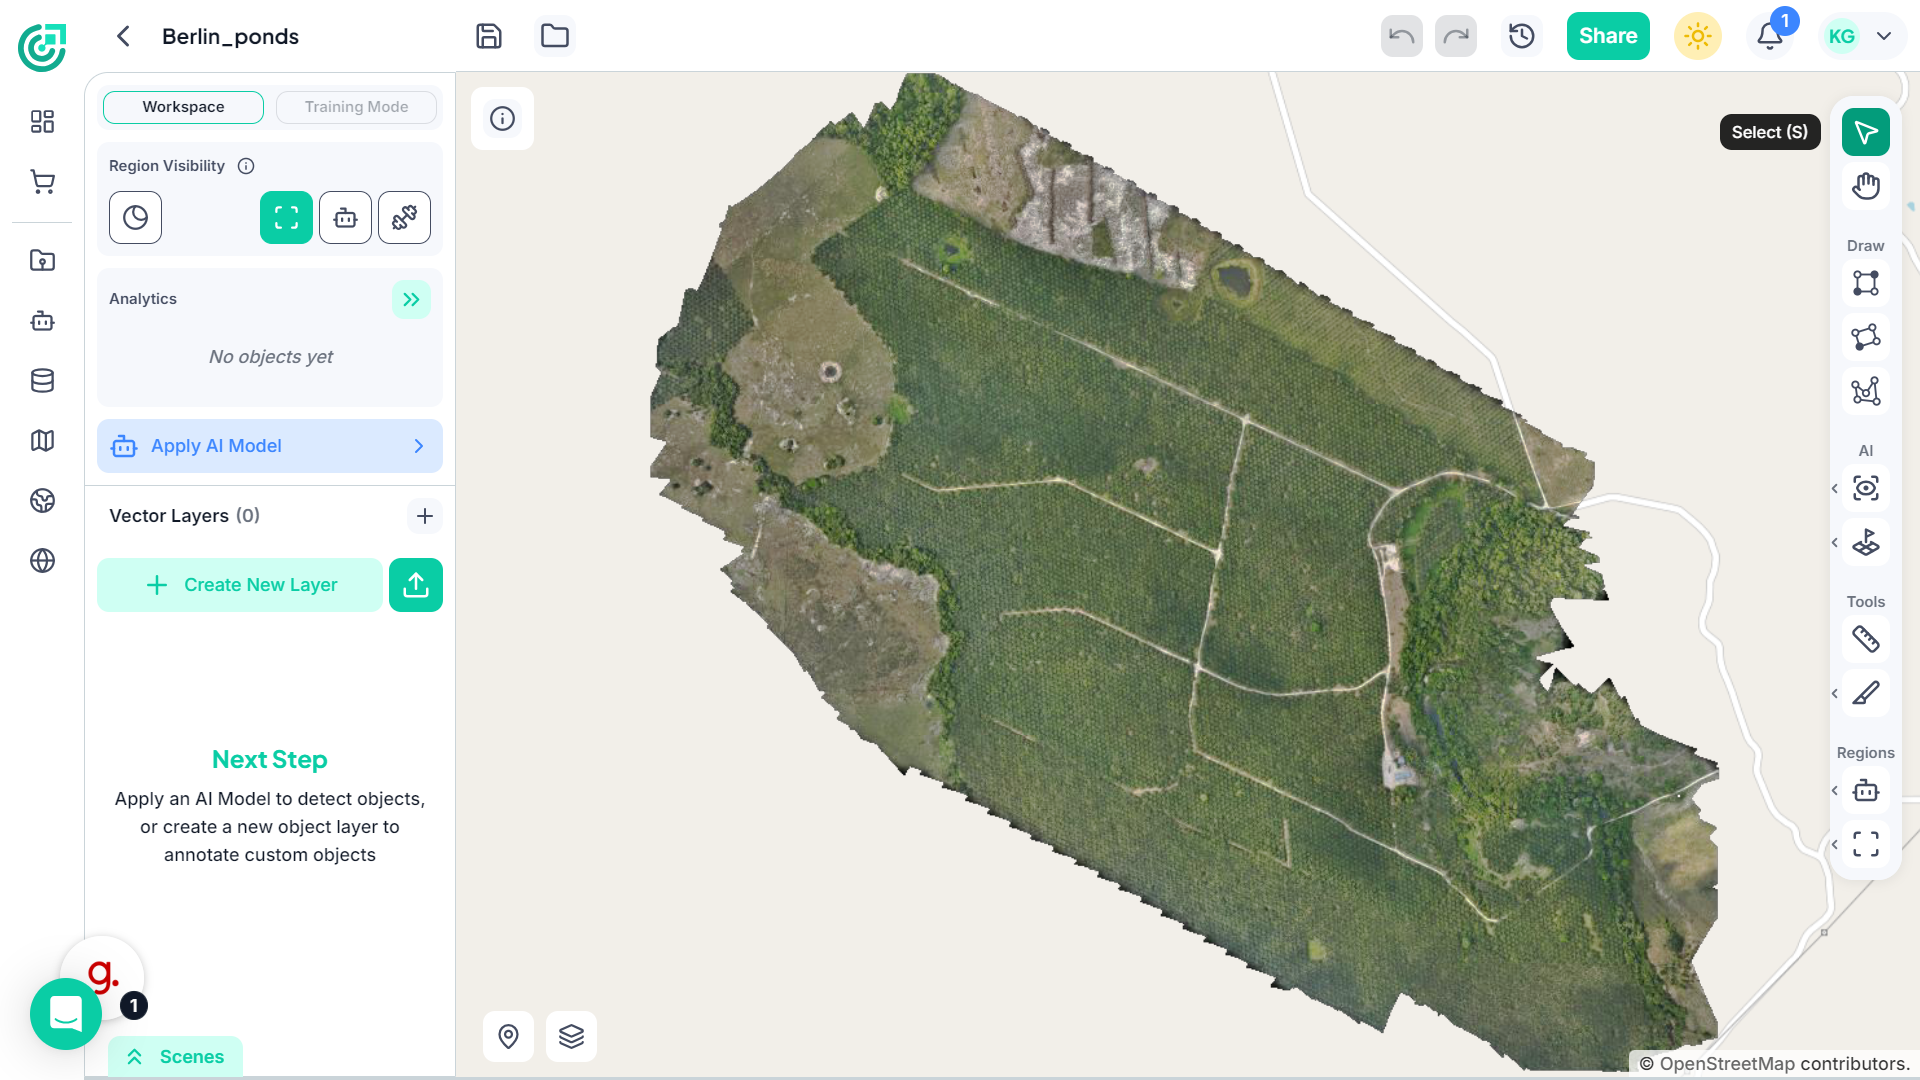
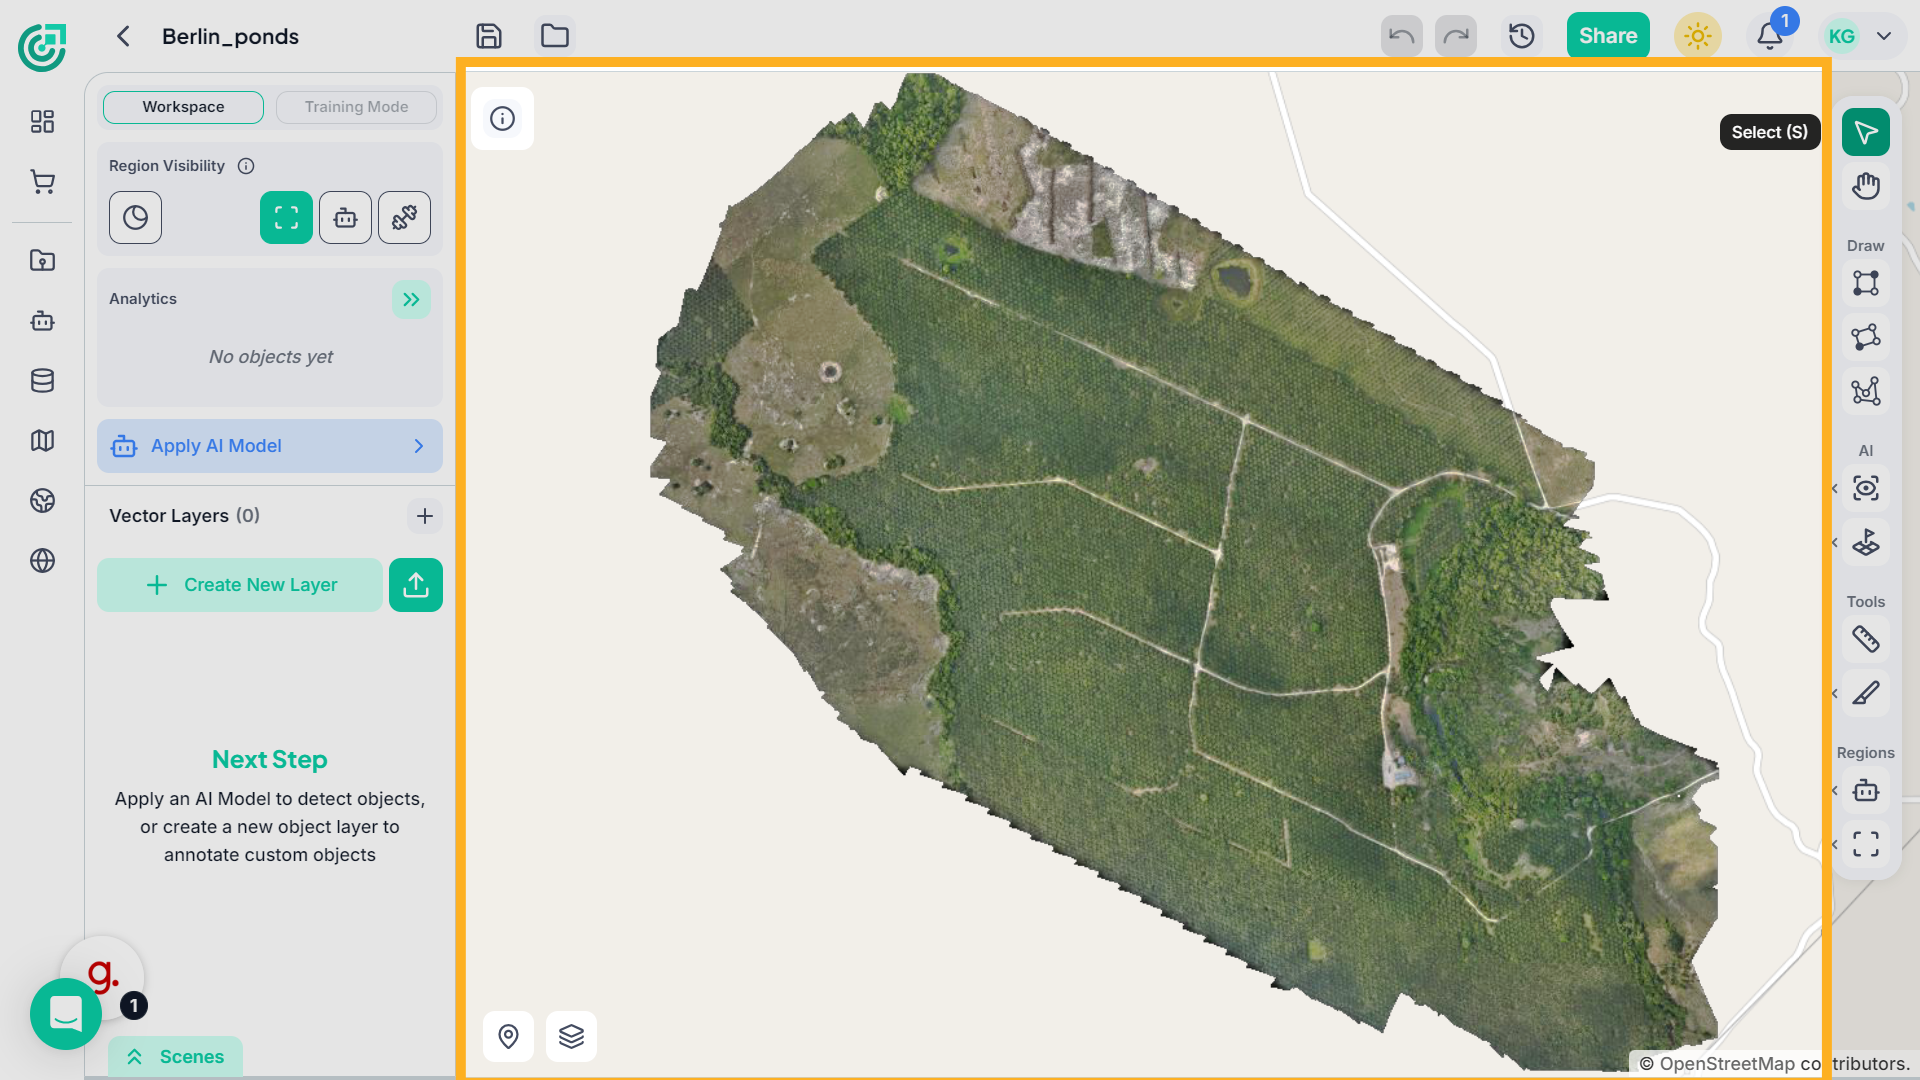
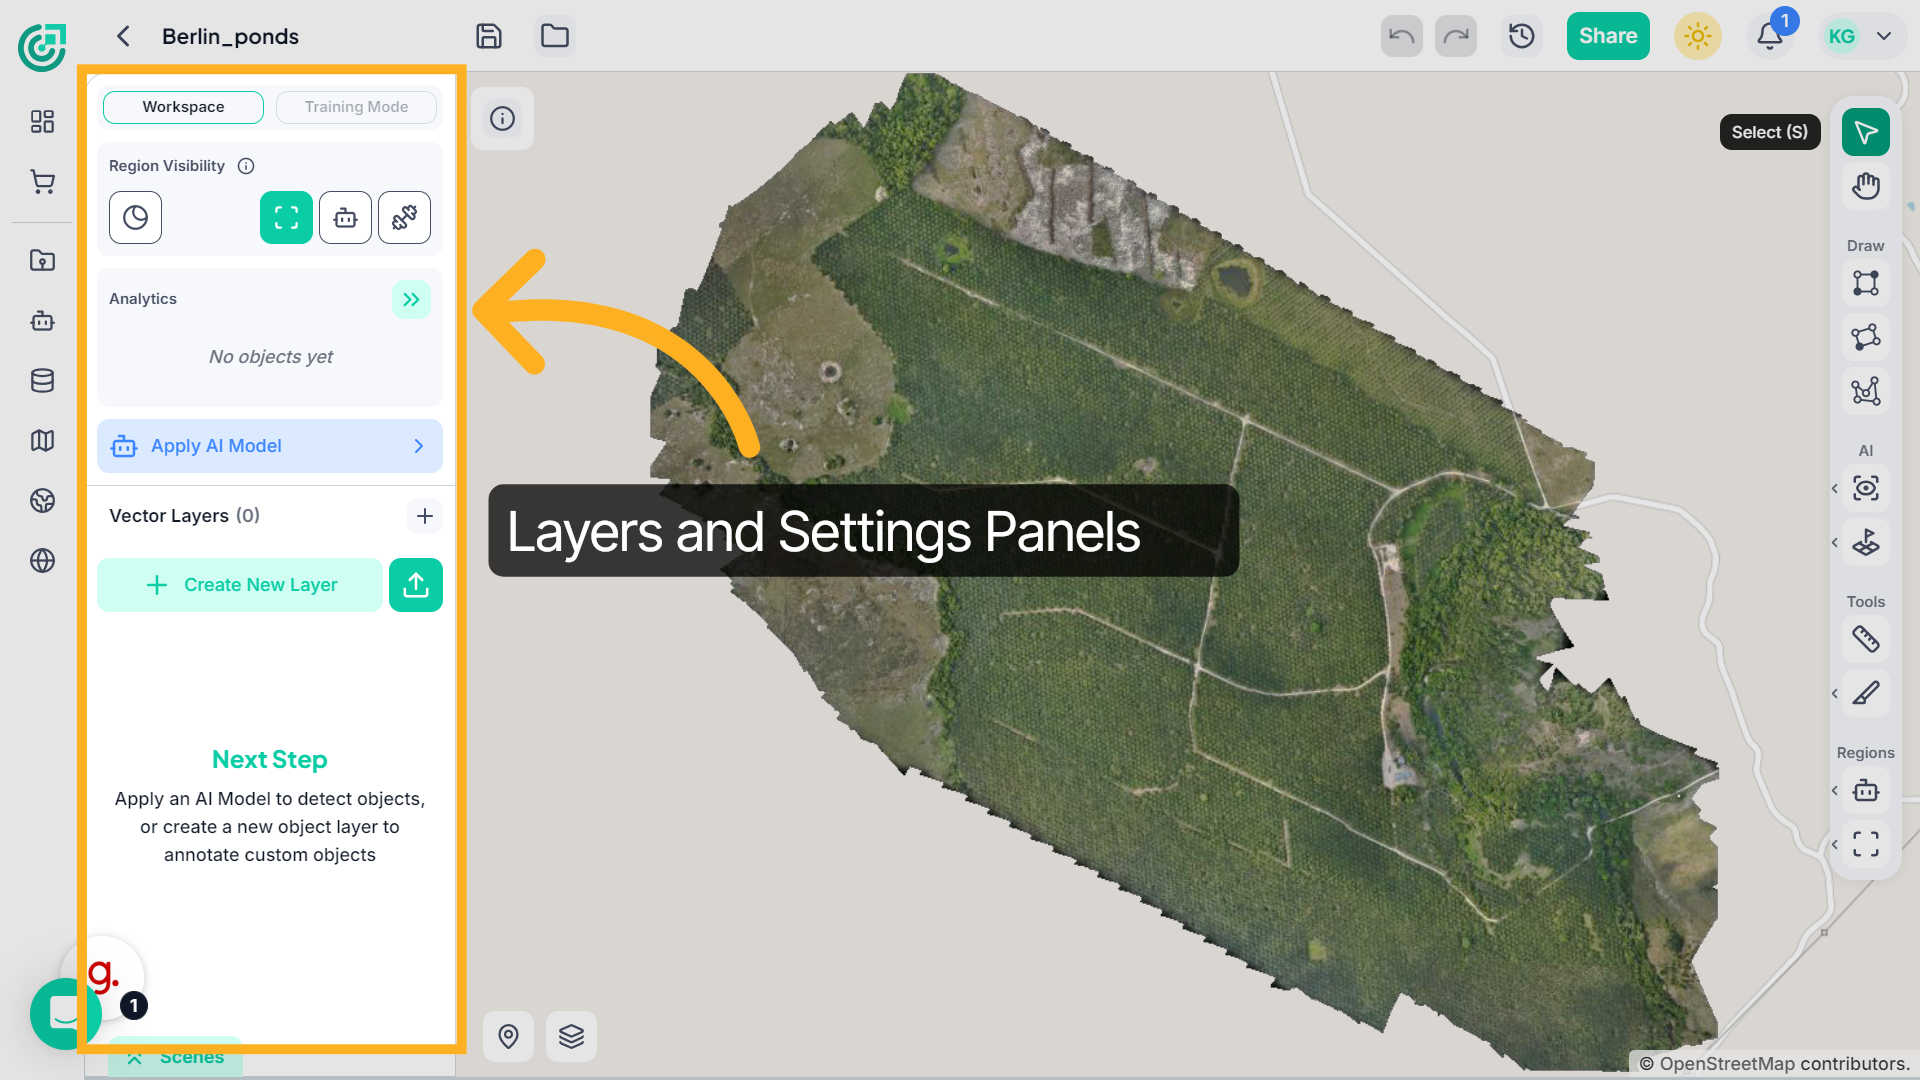
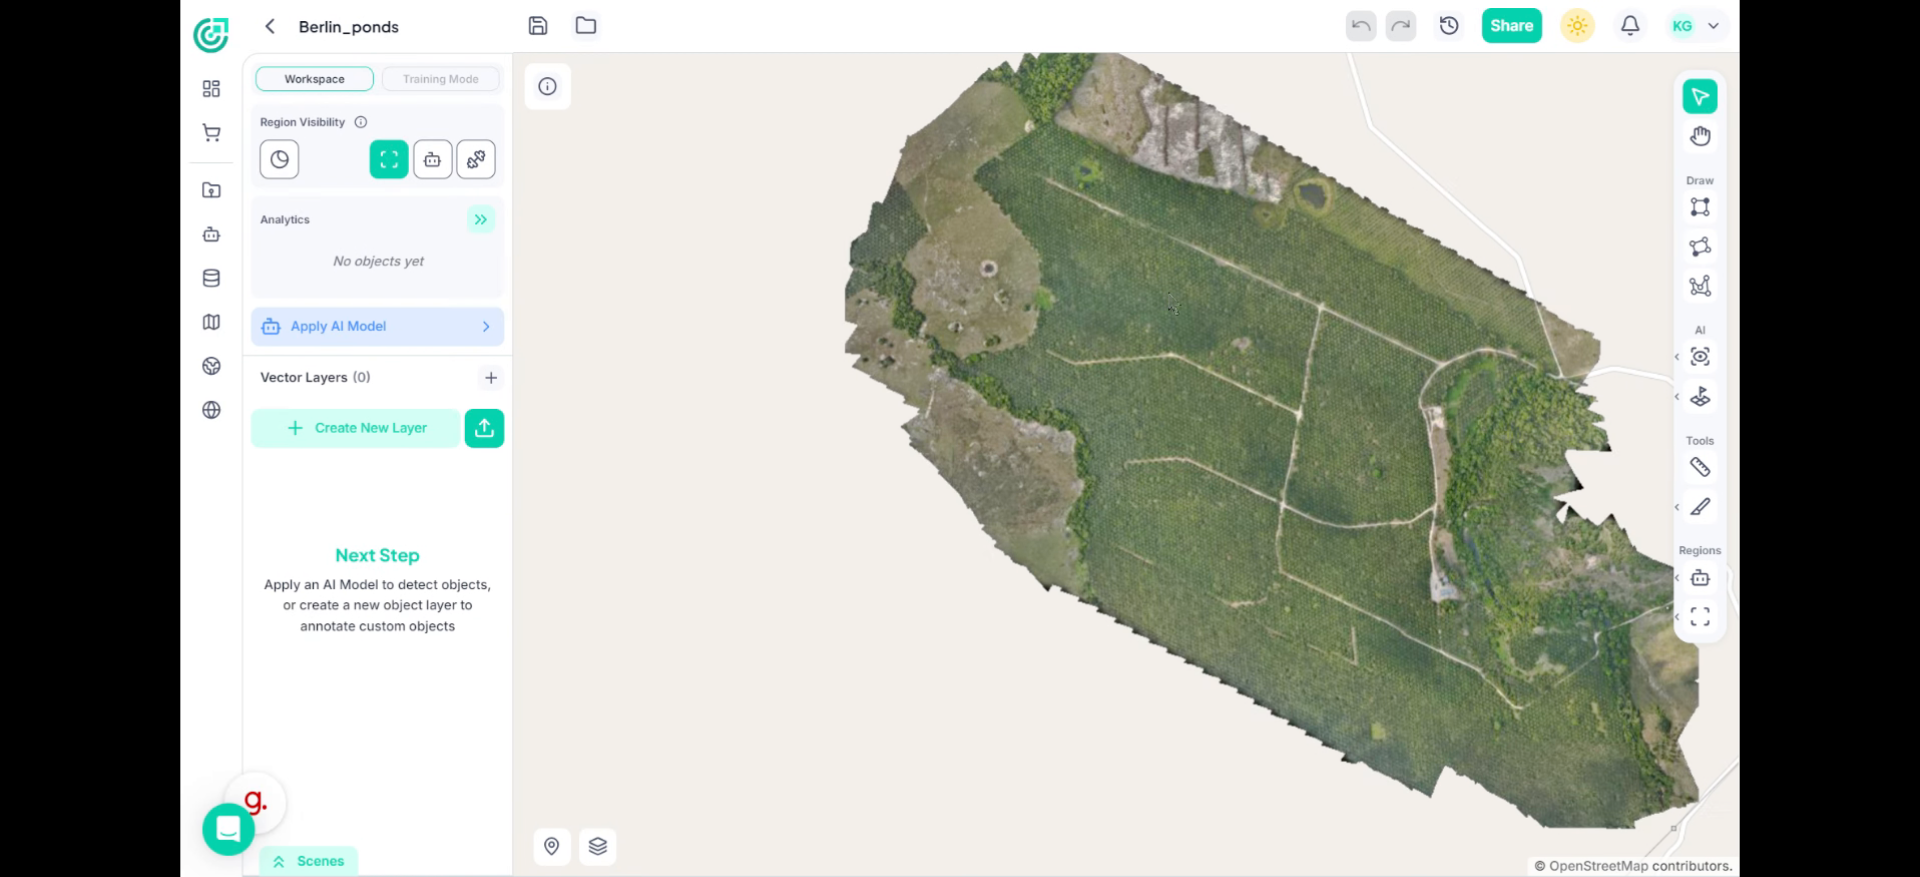
4. Understanding the Workspace Layout
The central area displays your raster imagery.
5. Understanding the Workspace Layout
On the right side, you’ll find selection and navigation tools.
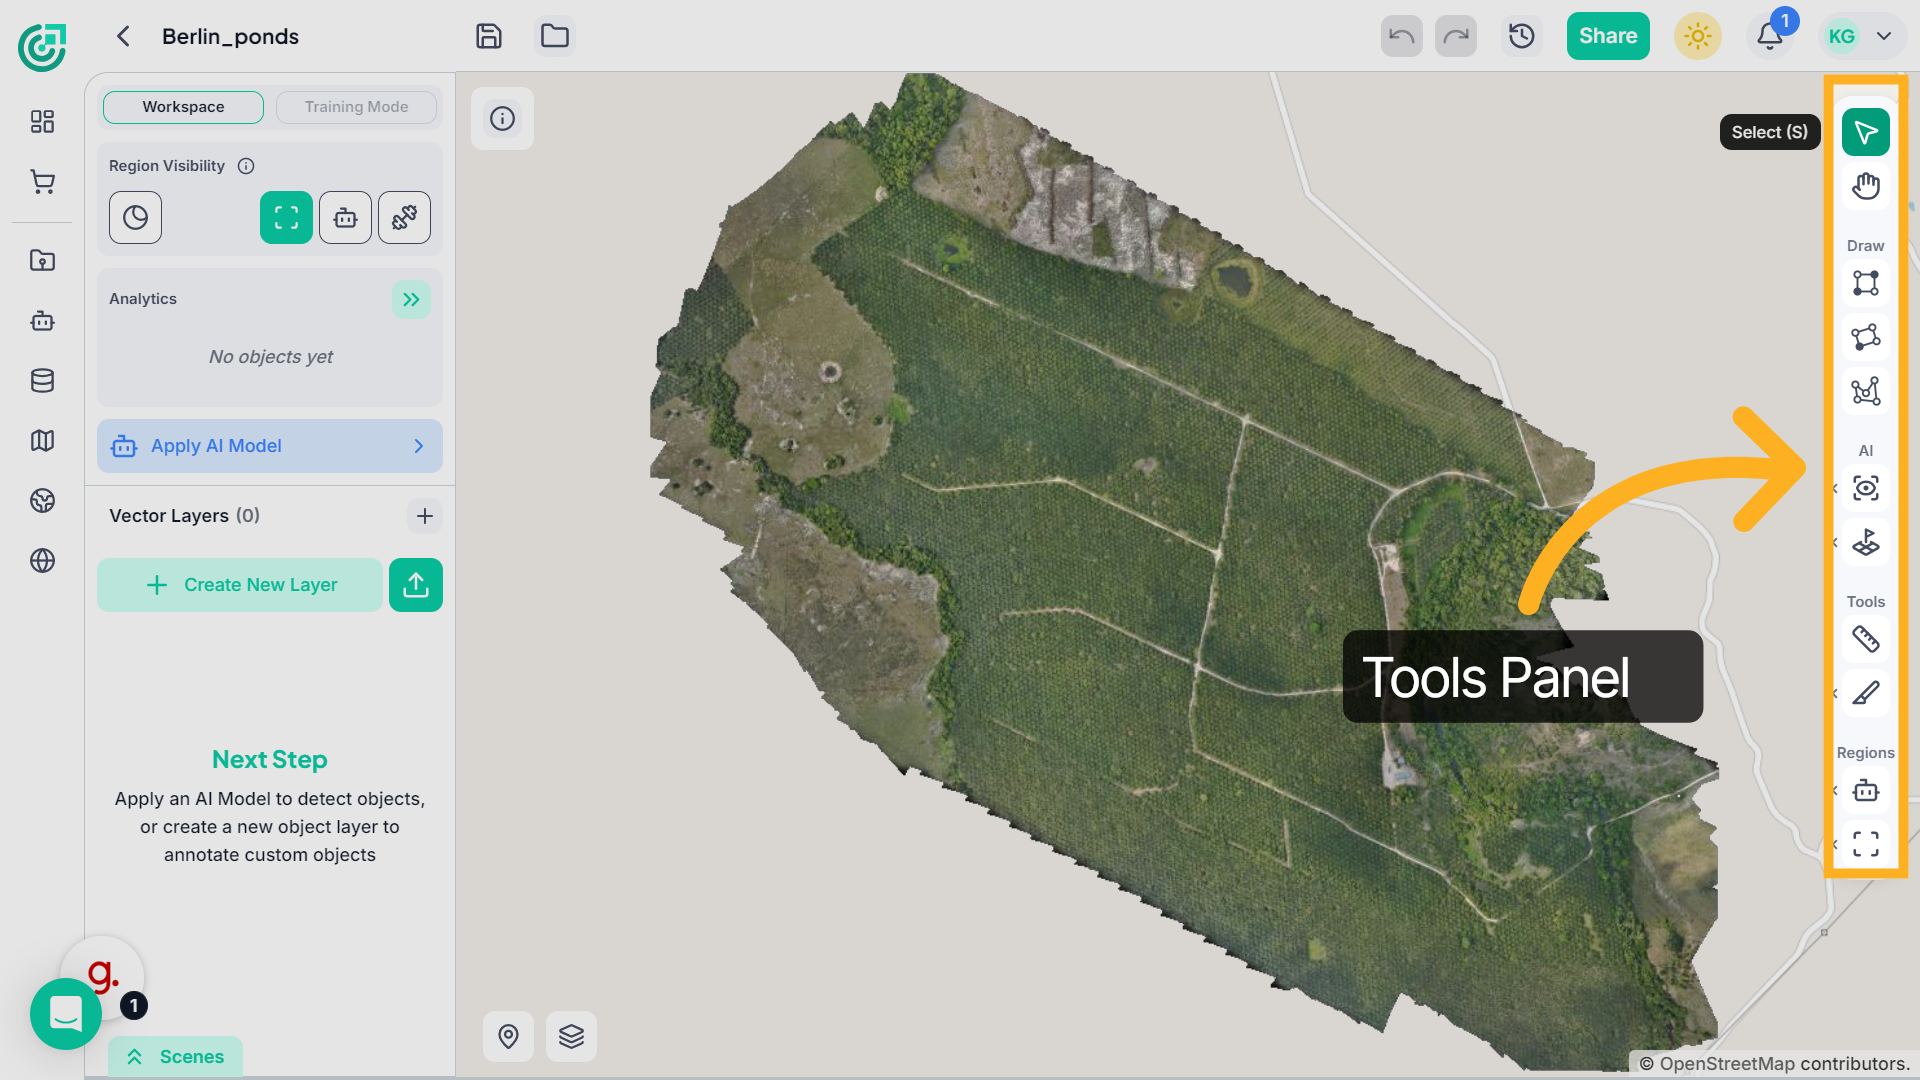
6. Understanding the Workspace Layout
Additional panels allow you to control layers, bands, and visualization settings.
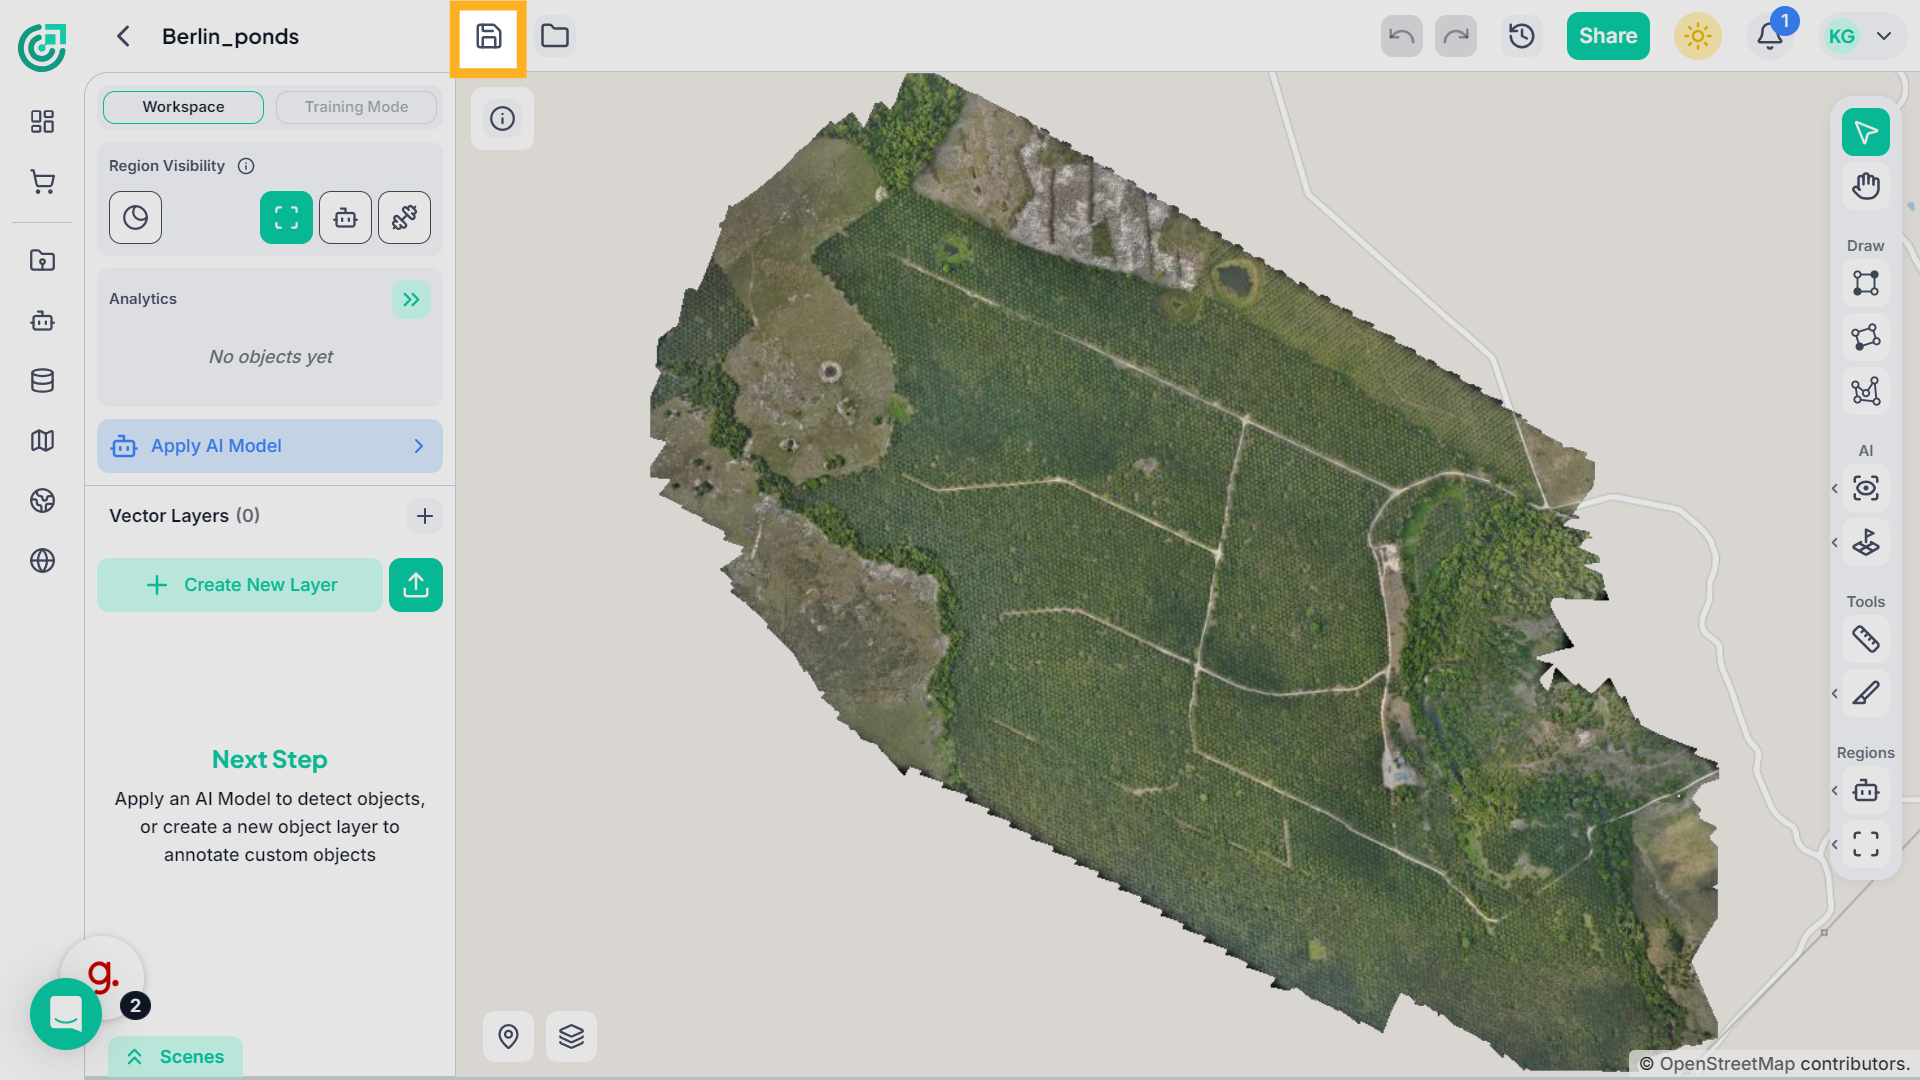
7. Identify Workspace Name
At the top of the screen, you can see the current workspace name.This helps you confirm which project you are actively working on.

8. Save Project Files
Next to the workspace name, use the Save icon to store your latest changes and ensure your progress is not lost.
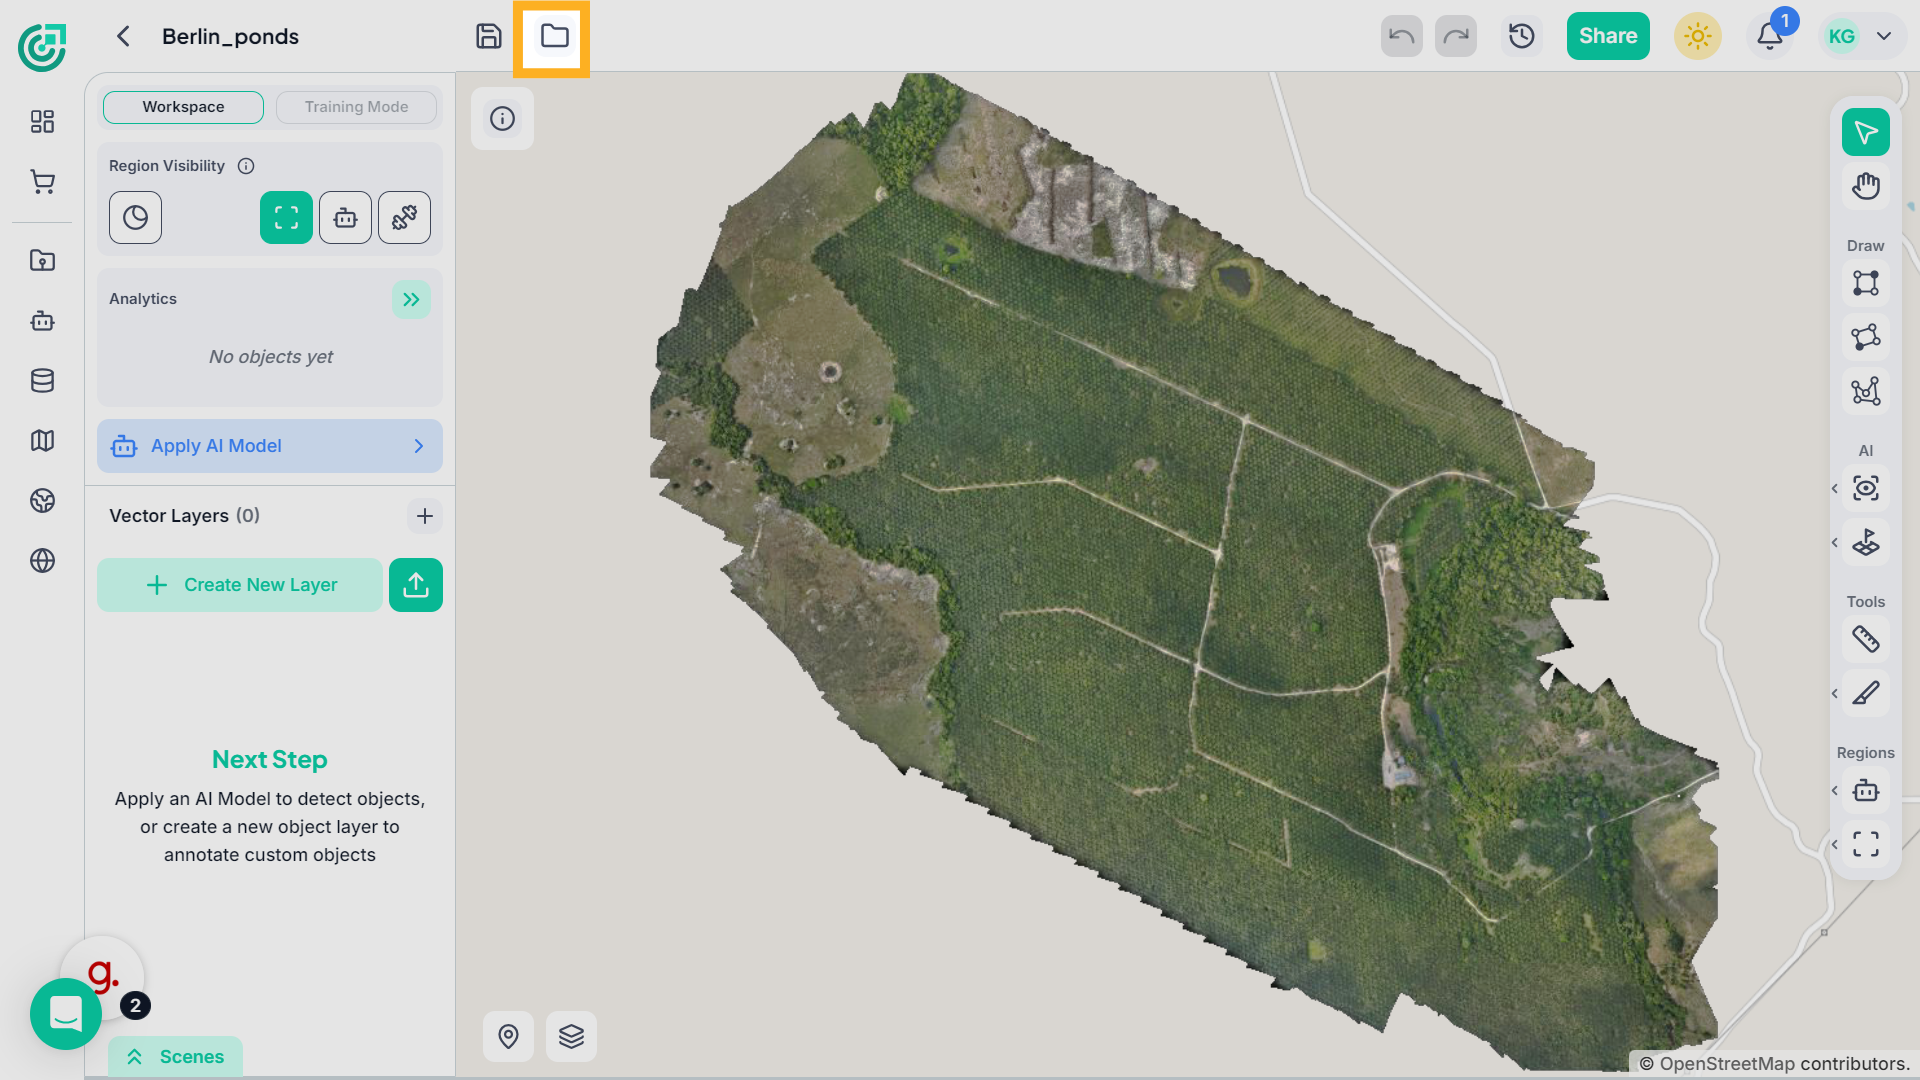
9. Manage Project Files
Beside it, the Folder icon allows you to access and organize your project files, helping you manage datasets and maintain a structured workspace.
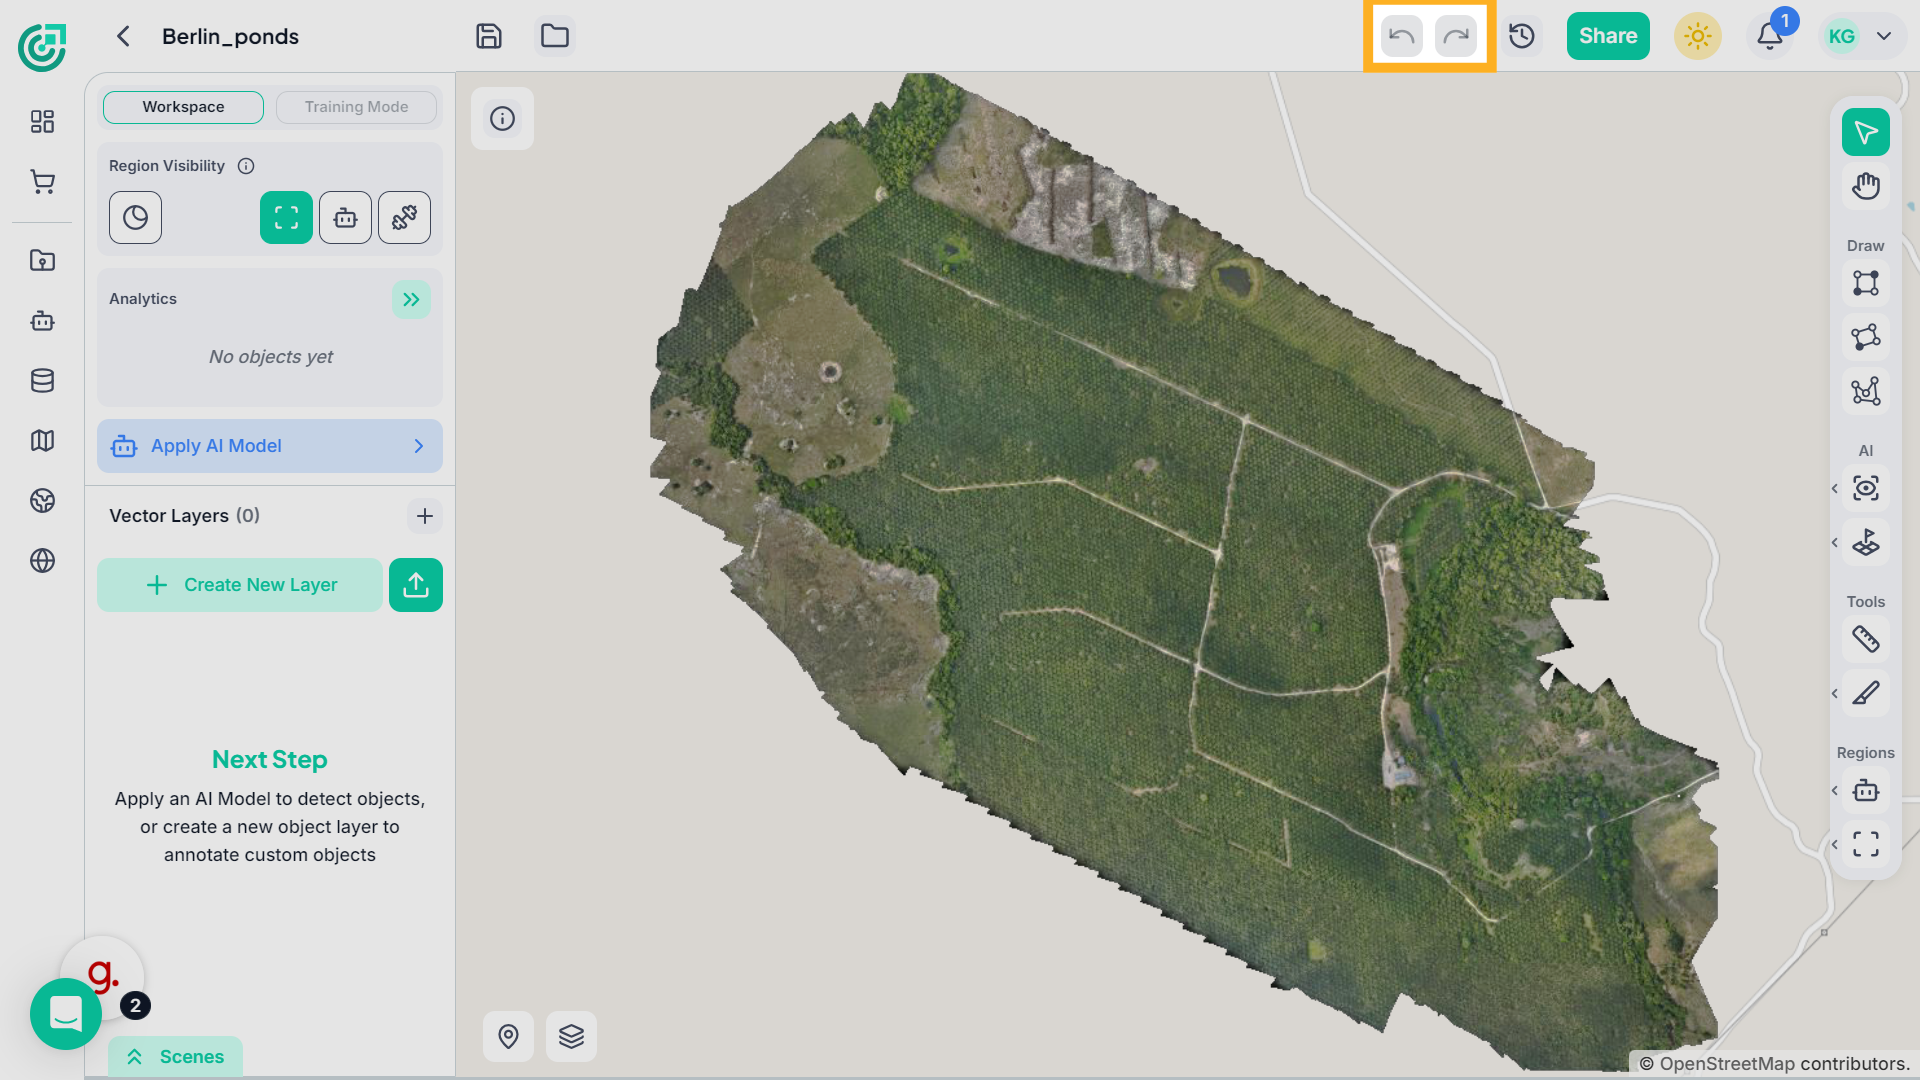
10. Undo and Redo Actions
On the top right, use the Undo and Redo buttons to quickly revert or reapply recent changes.These controls help you correct mistakes without losing progress.
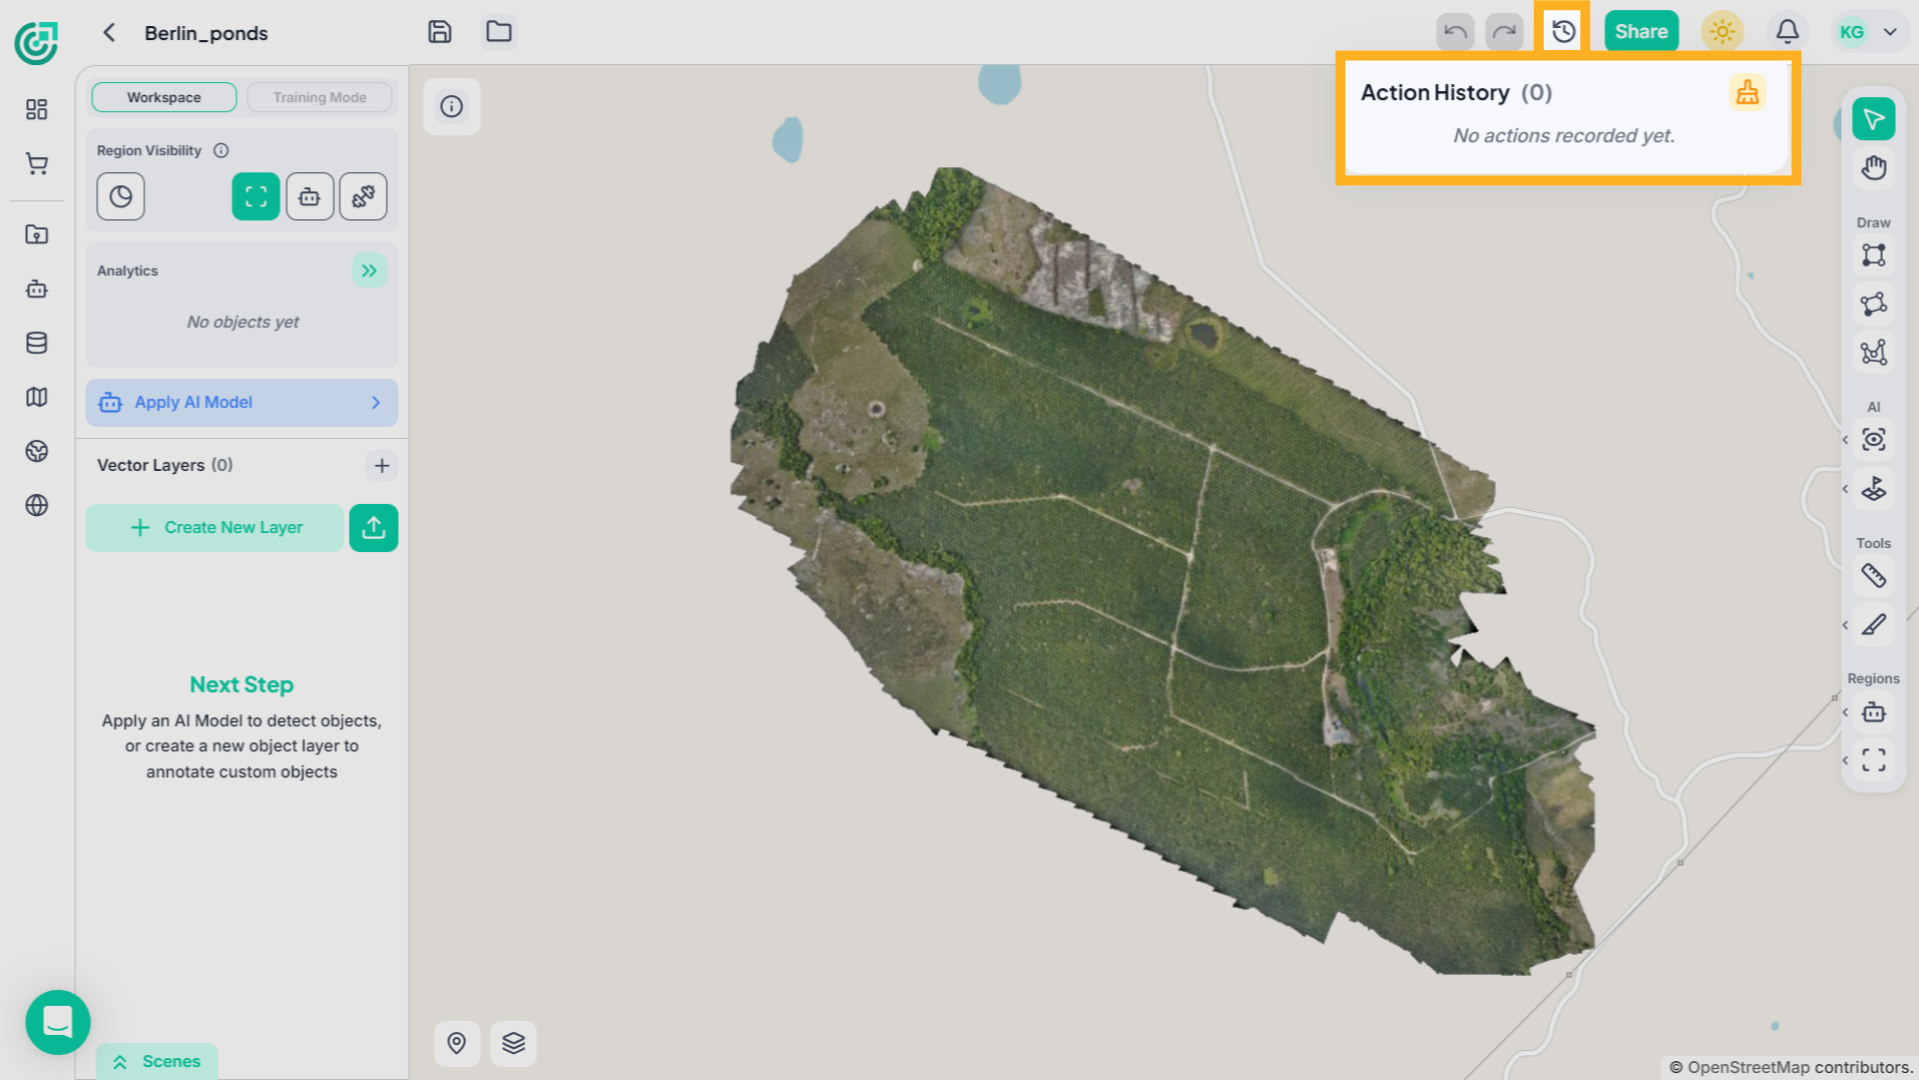
11. History
Next to them, the History icon provides a detailed view of previously performed actions within the workspace. This helps you track changes over time and maintain full control over your editing process.
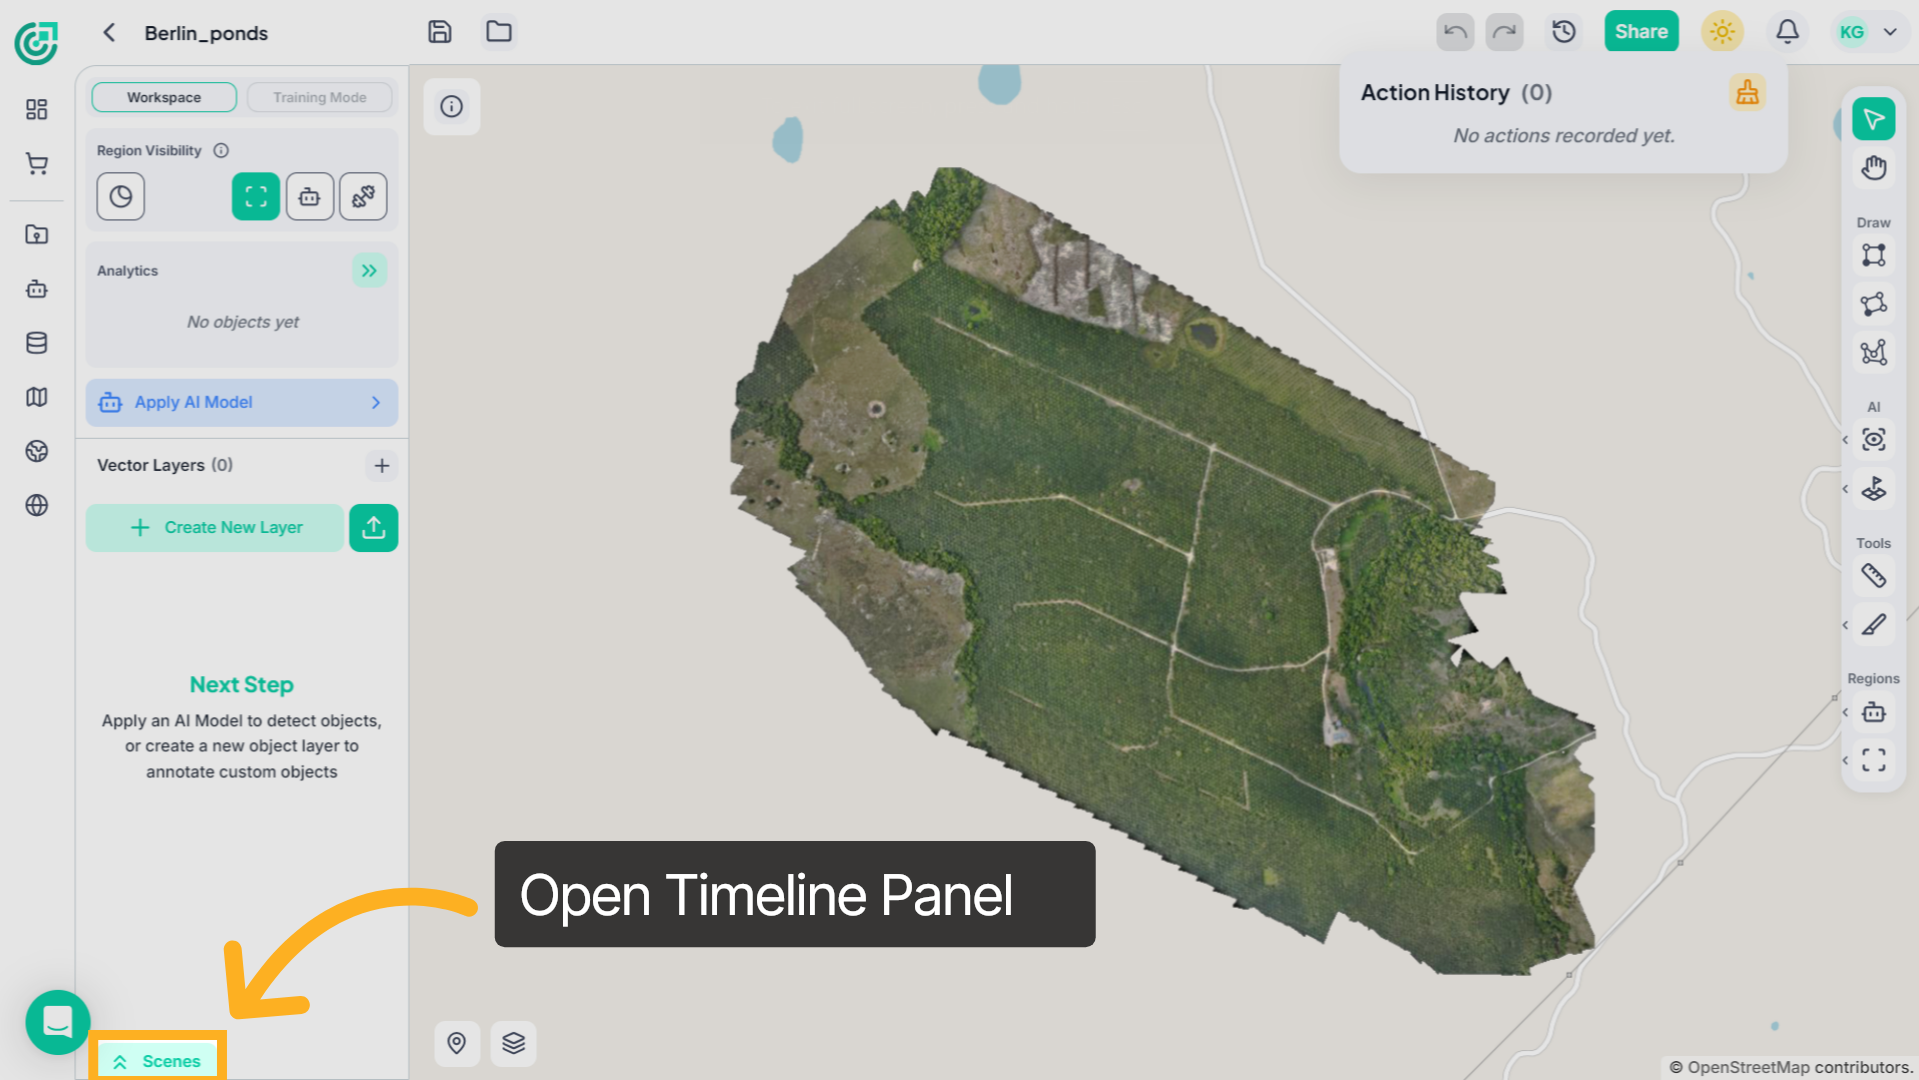
12. Open Timeline Panel
At the bottom of the workspace, open the Timeline panel to manage project versions.
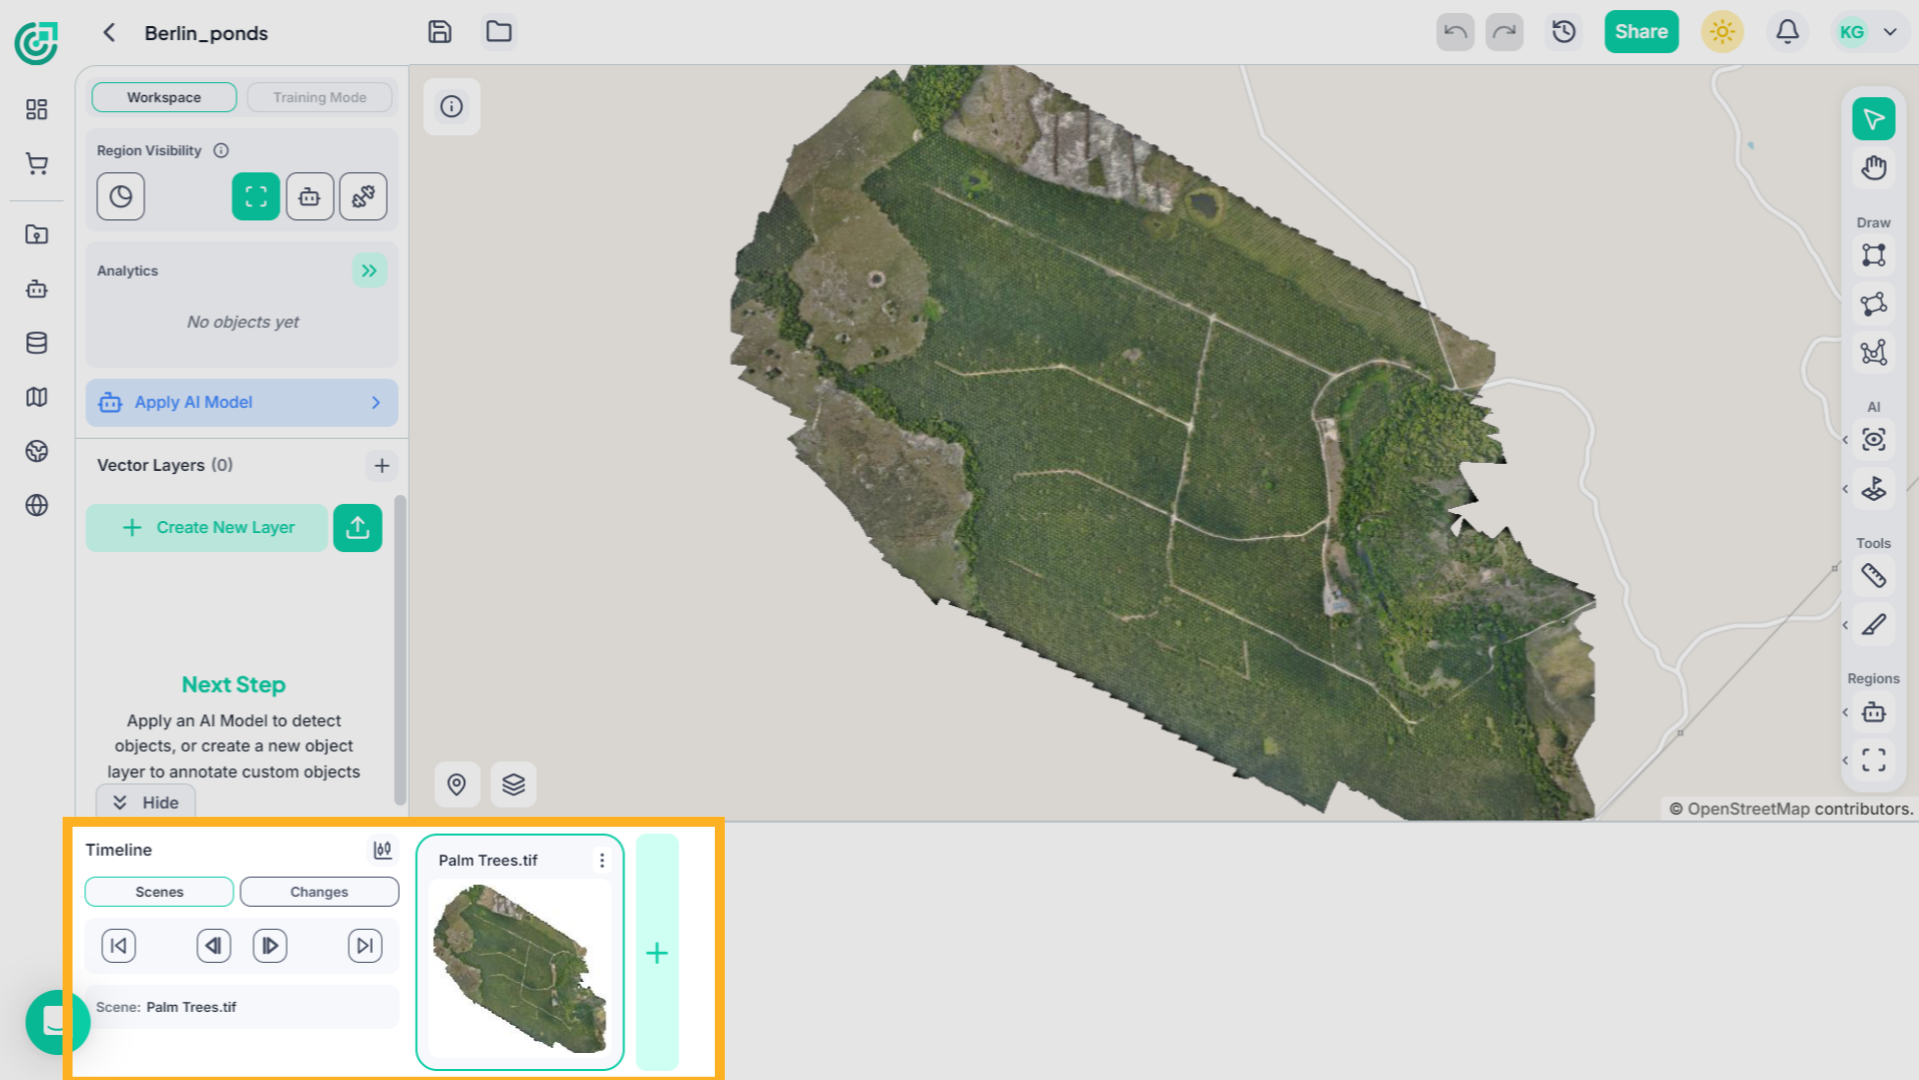
13. View Current Scene
Under the Scenes tab, the thumbnail shows the current saved state of your workspace. Use the playback controls to navigate between scenes, and click the (+) button to capture and save a new scene for version tracking.
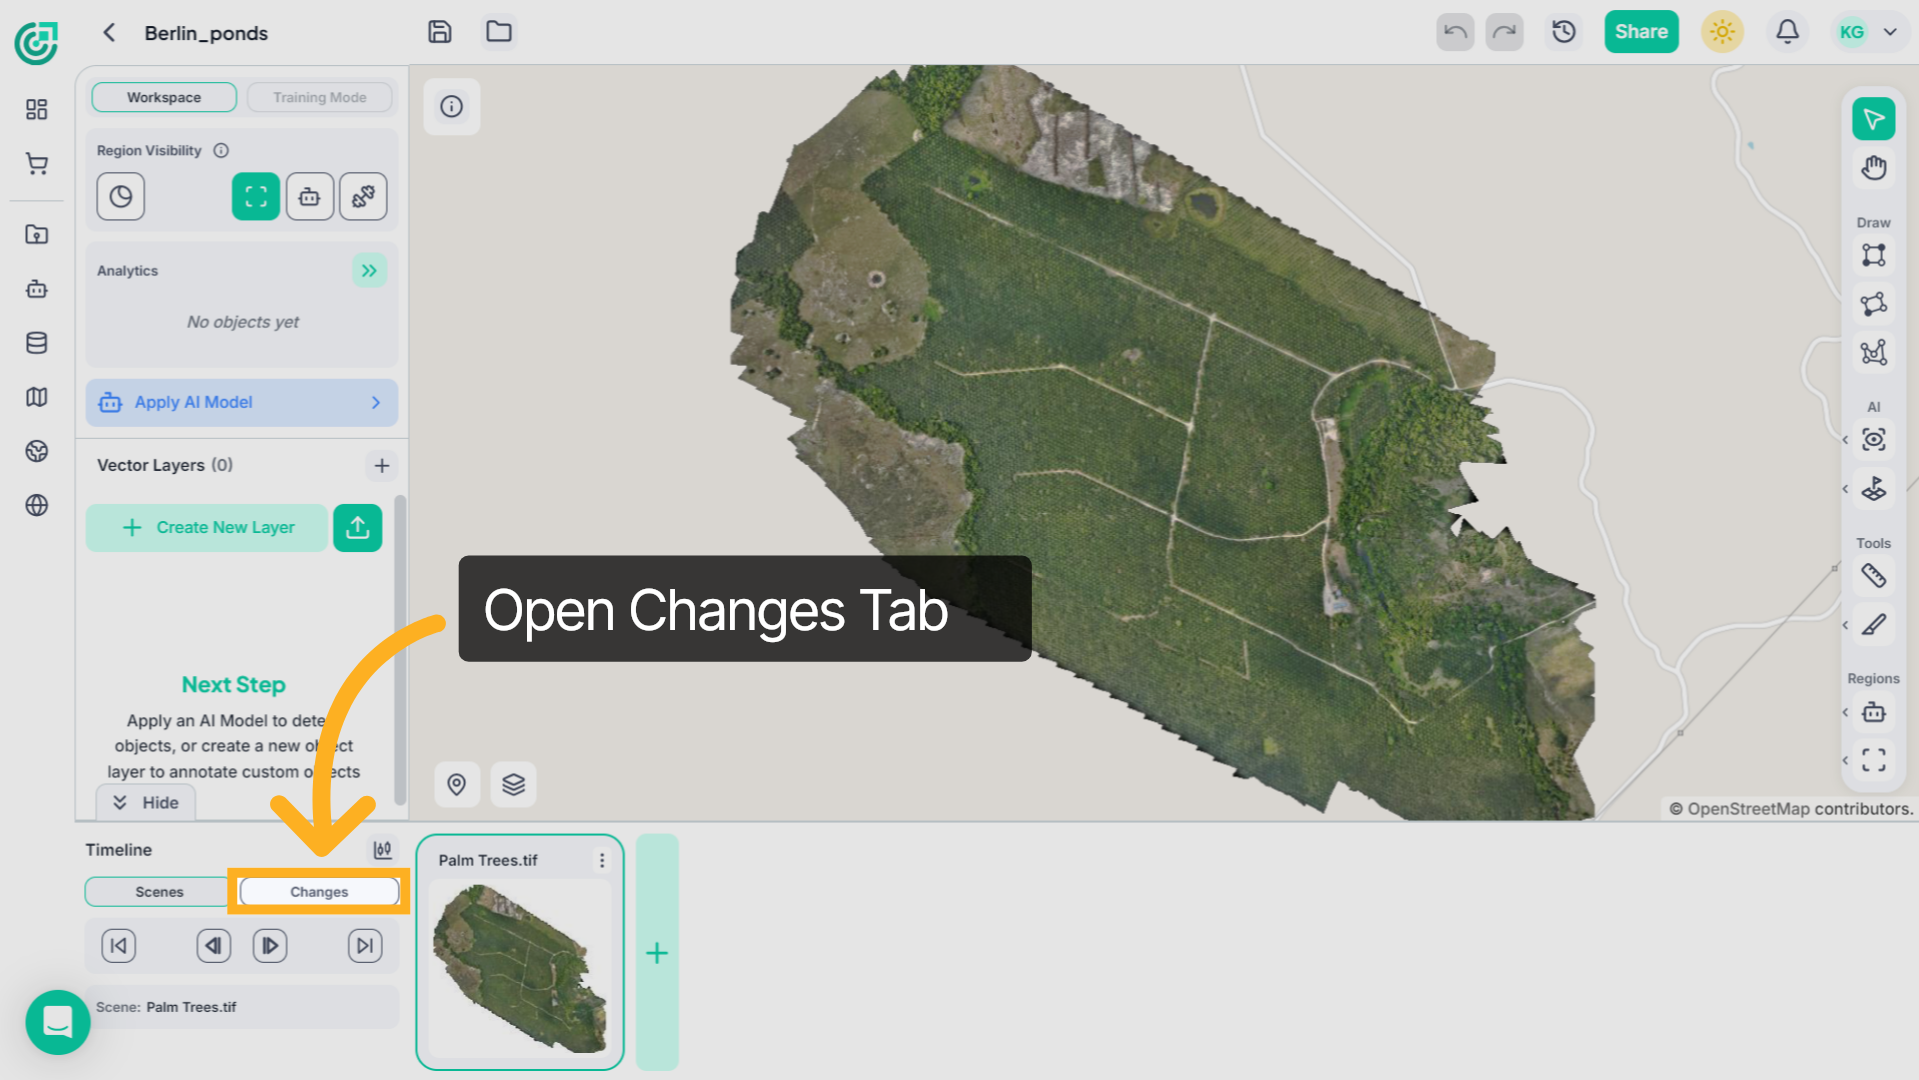
14. Open Changes Tab
Now switch to the Changes tab in the Timeline panel.
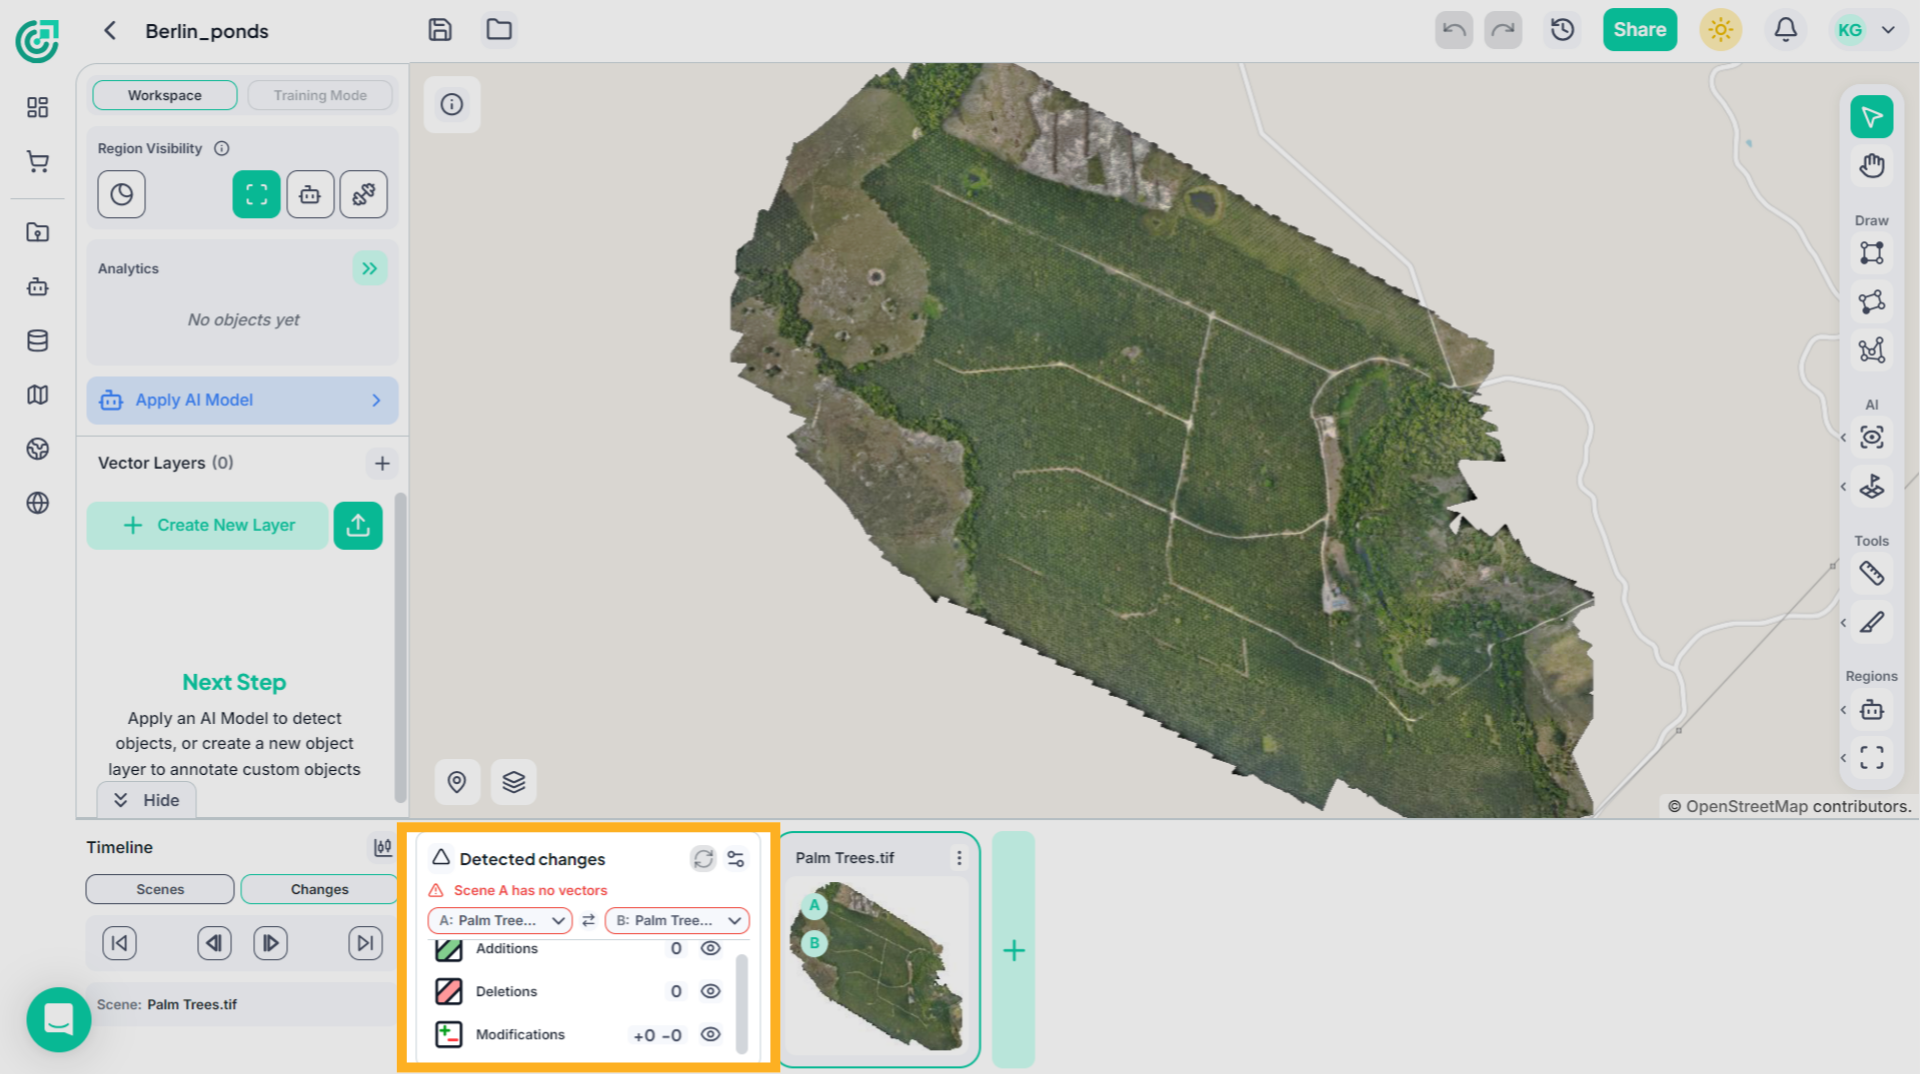
15. Review Detected Changes
This section lets you compare two scenes. Select Scene A and Scene B from the dropdowns to choose the versions you want to analyze. The system will show detected Additions, Deletions, and Modifications, and you can use the eye icon to toggle their visibility on the map.
16. Object Selection Tool
The Select (S) tool is active by default and is the primary interaction tool in the workspace.
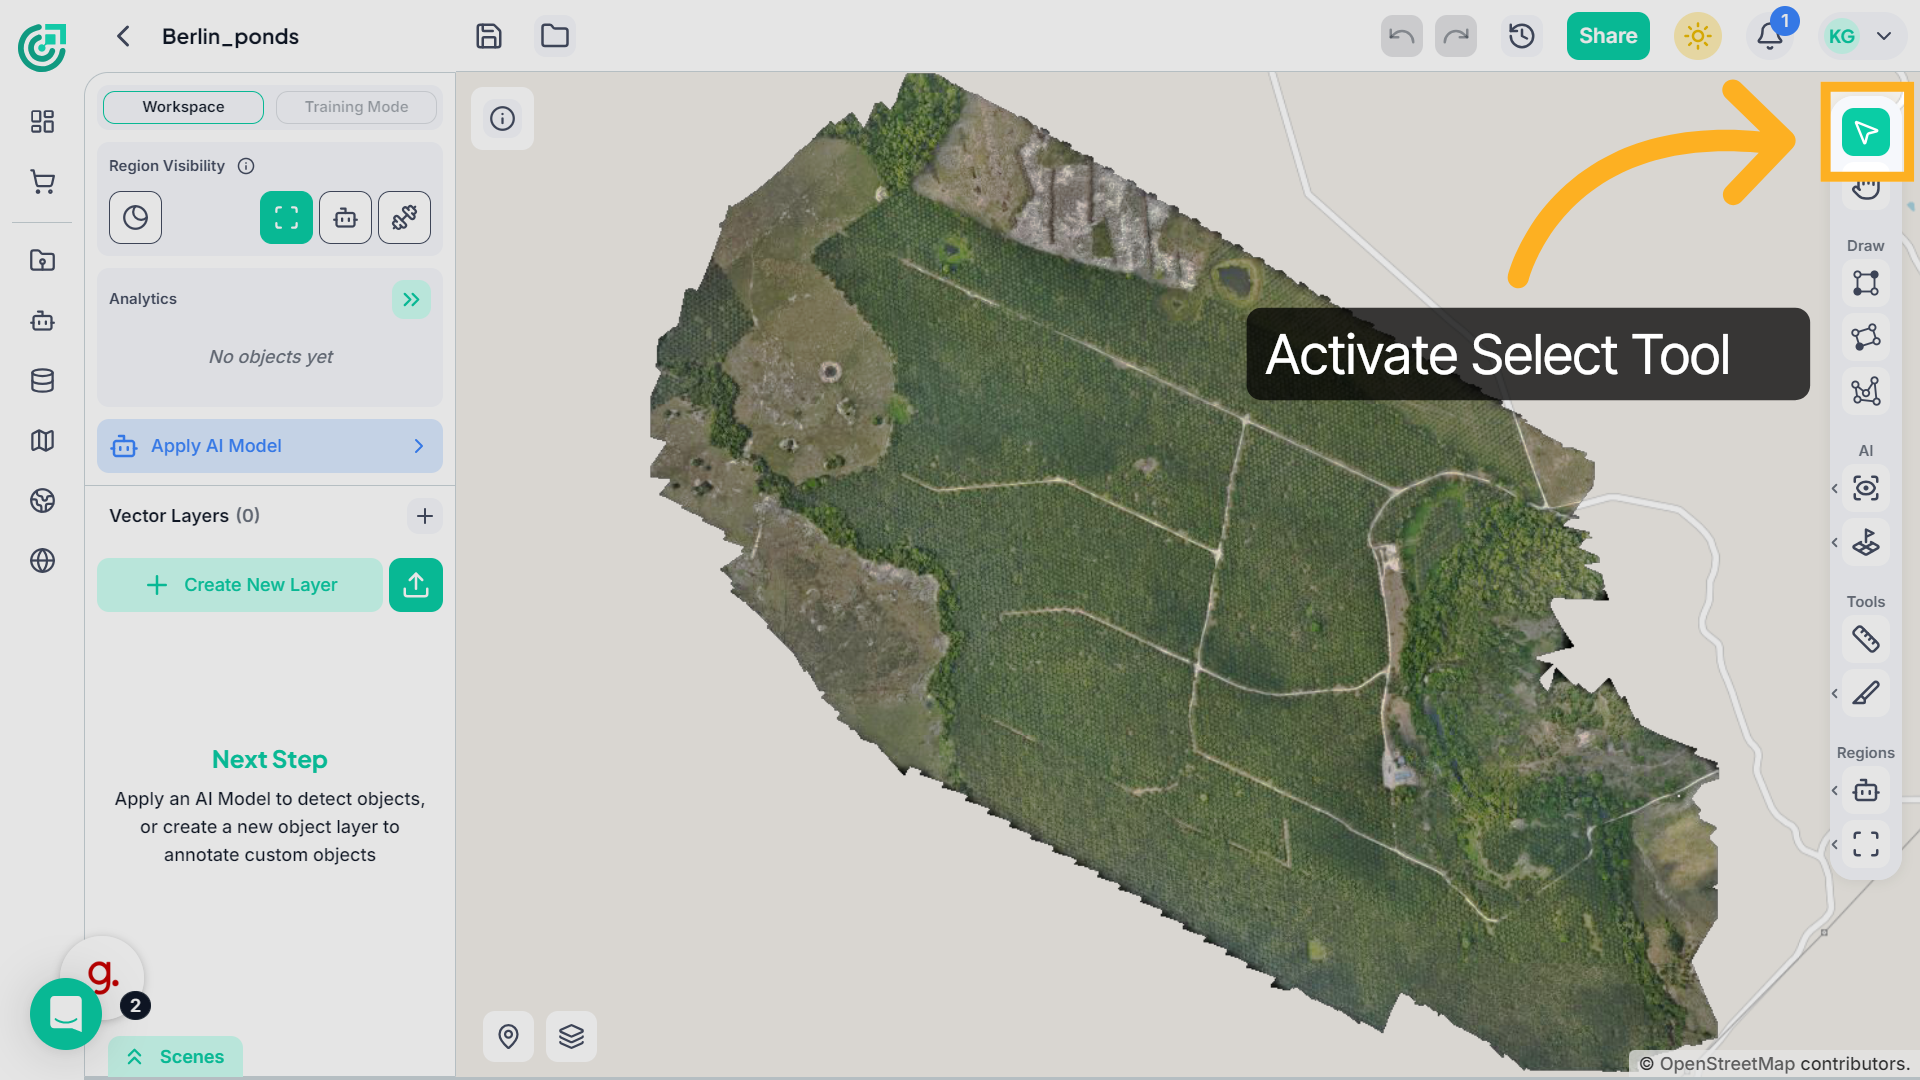
17. Object Selection Tool
Use it to select and manage objects. You can also browse the raster by clicking and holding the middle mouse button, which works the same as the Pan tool.
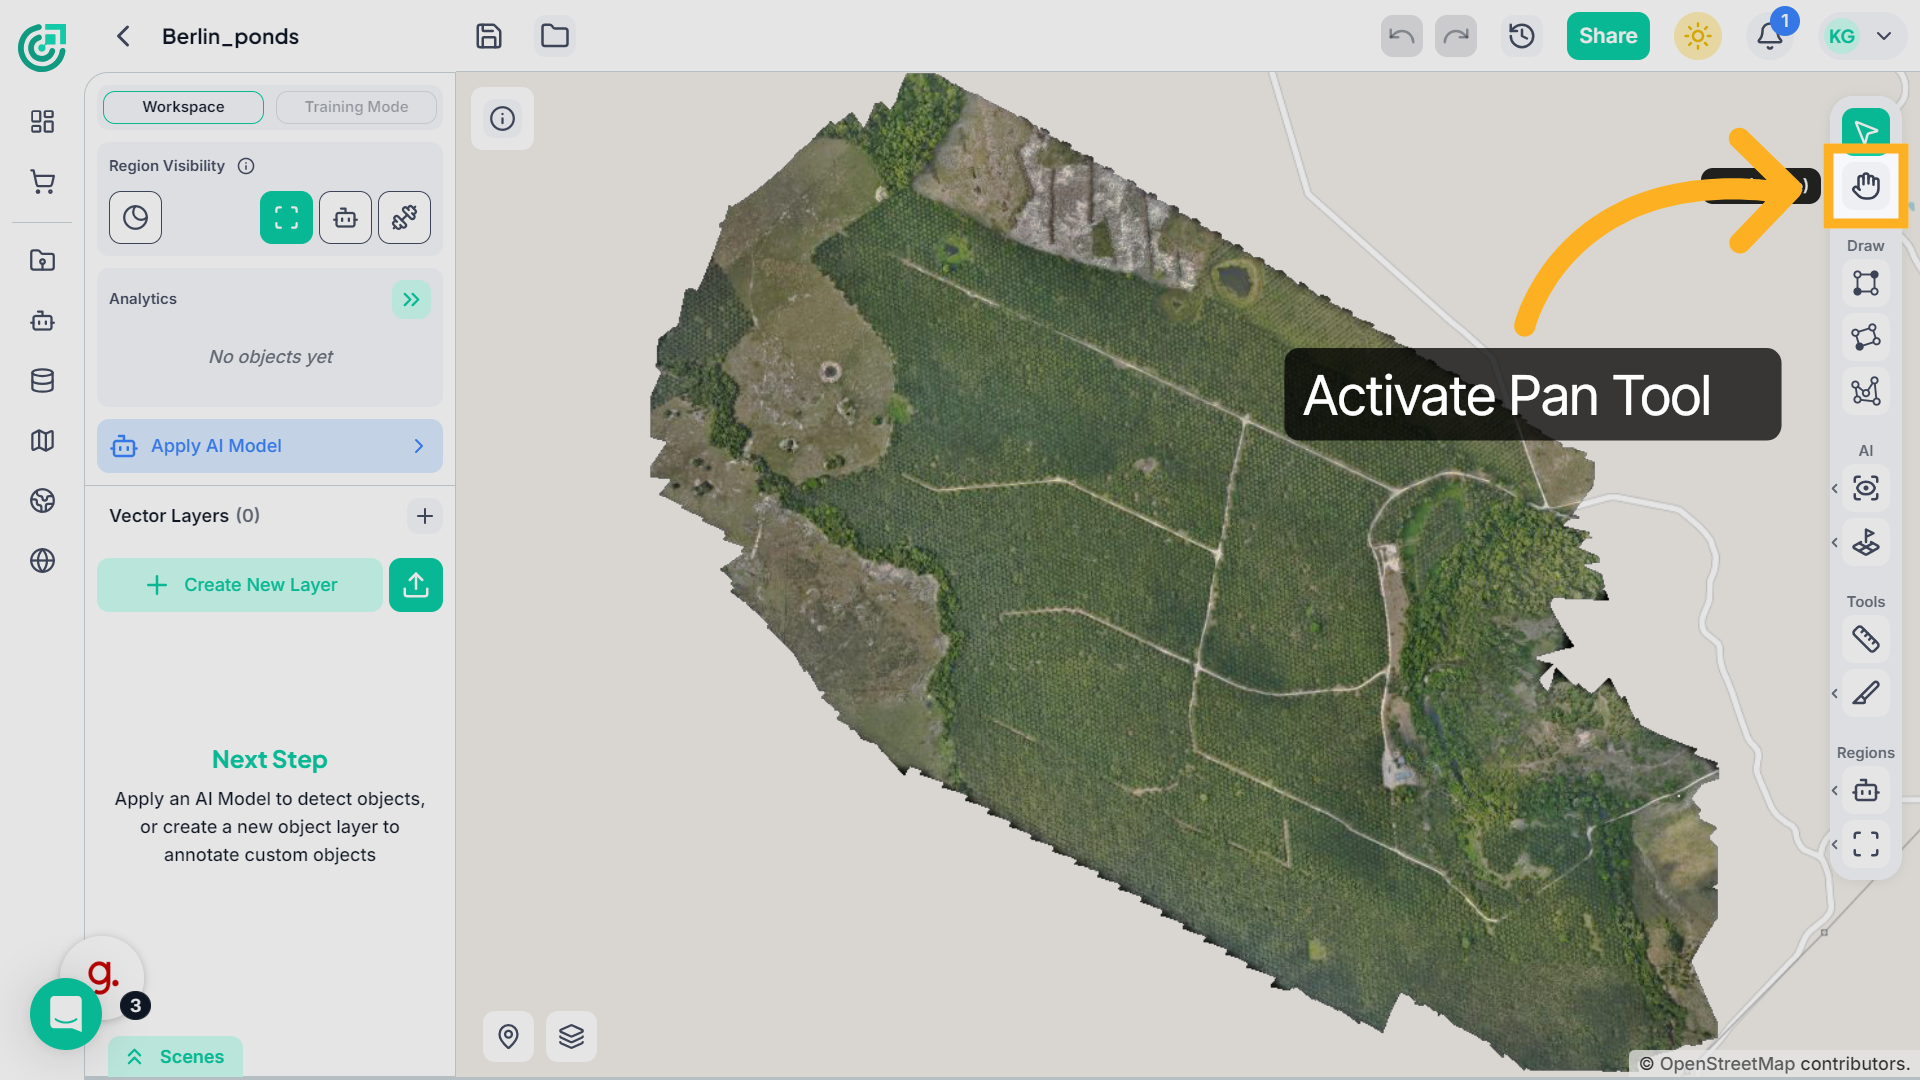
18. Pan Across the Map
To move across the imagery, first activate the Panning tool from the toolbar. Then double-click anywhere on the image to engage the hand mode. Once activated, hold the left mouse button and drag to reposition the imagery according to your view.
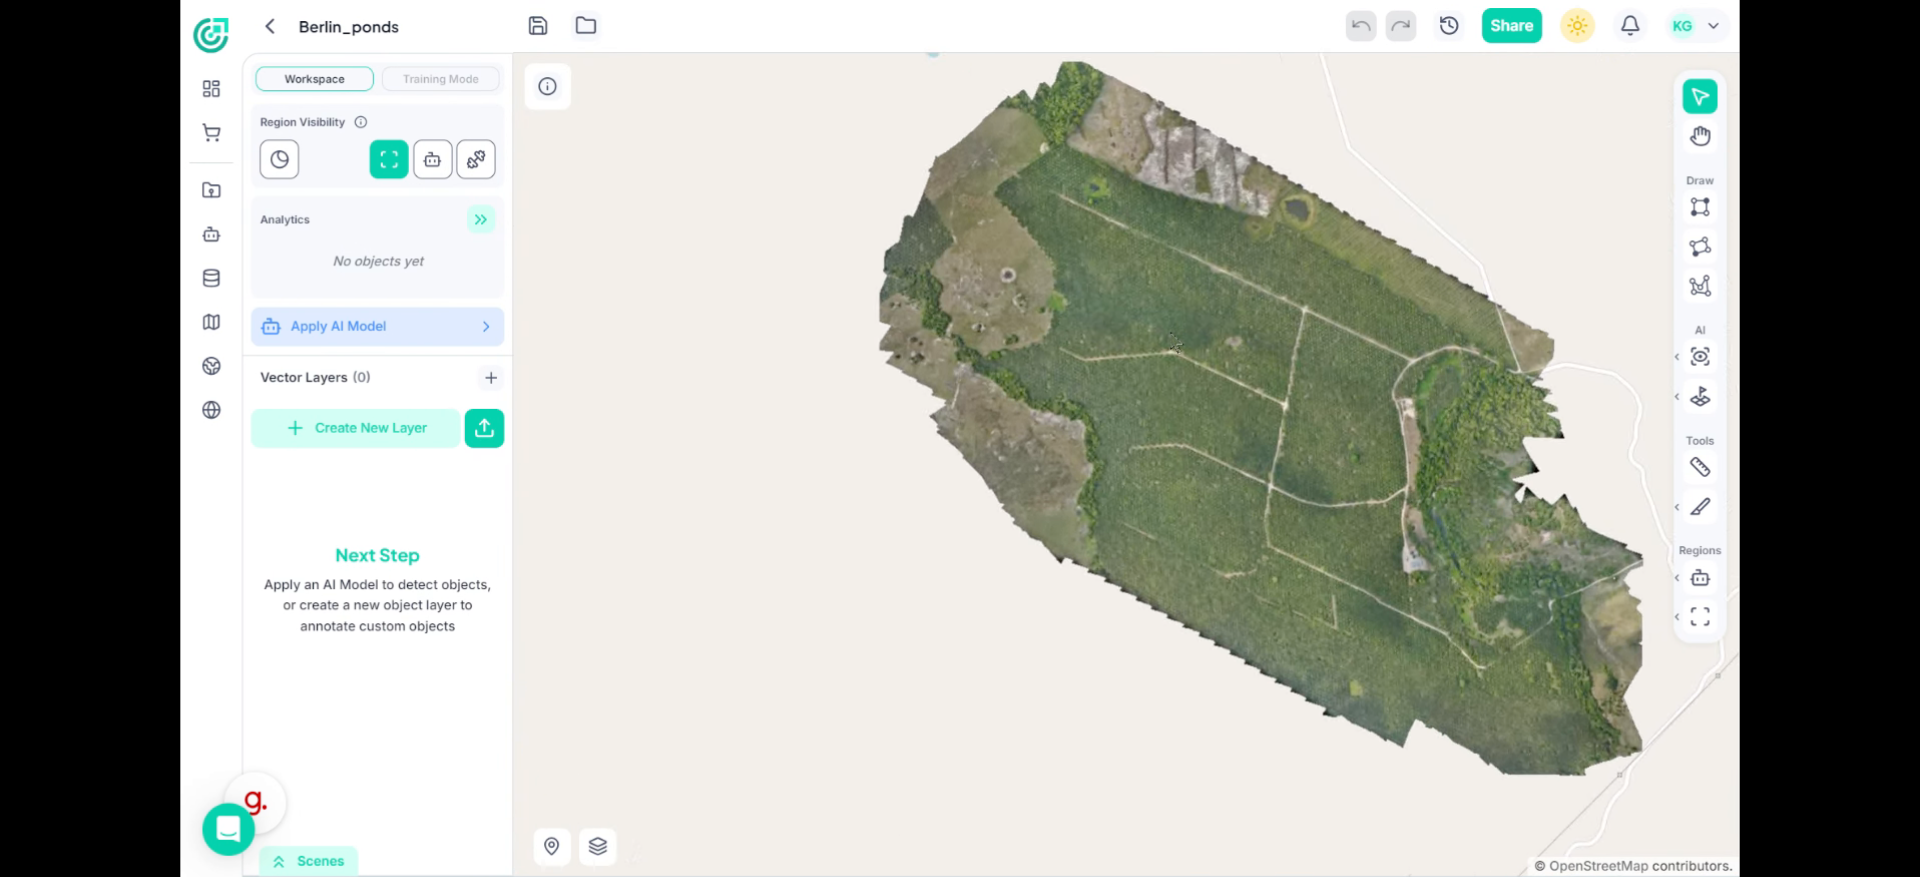
19. Zoom In View
Use your mouse scroll wheel or trackpad gestures to zoom in and out. Zooming helps you inspect fine details or review the full spatial context.
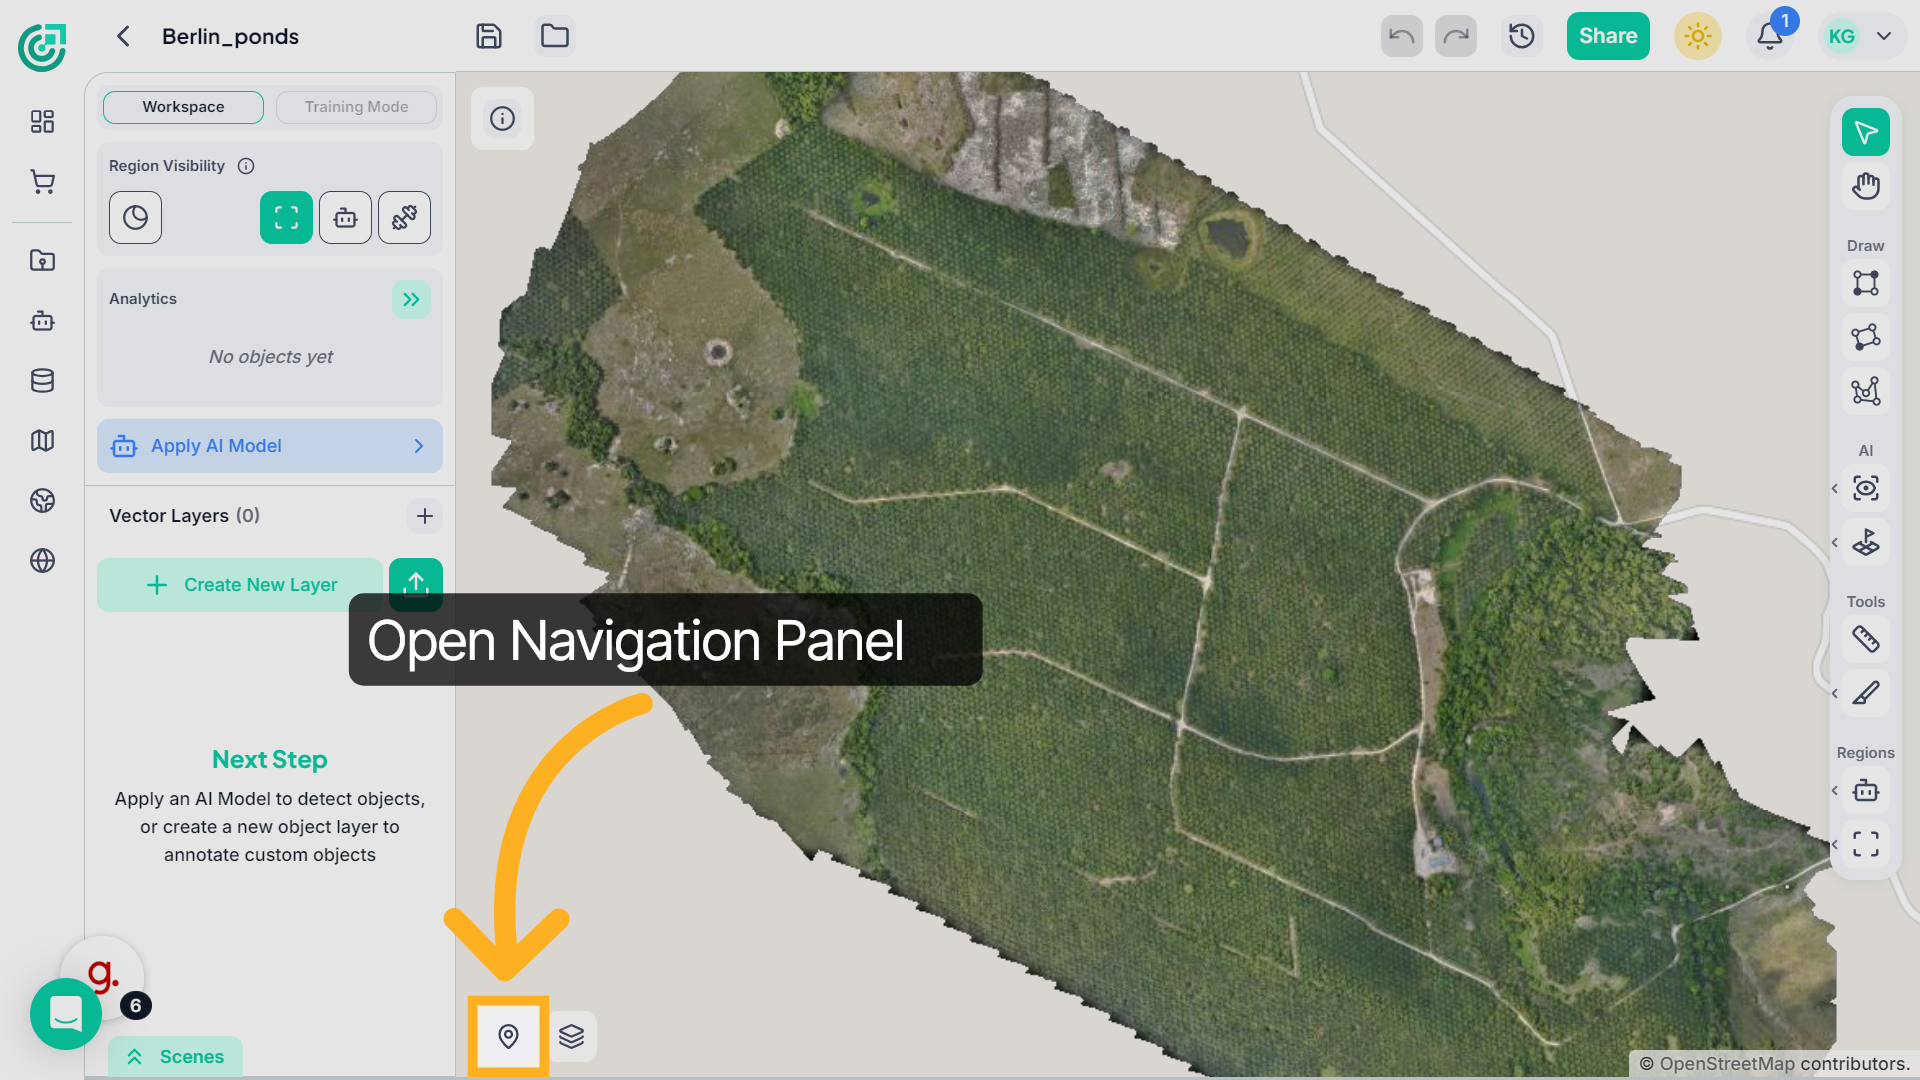
20. Jump to Specific Coordinates
Open the Navigation panel to jump directly to a specific latitude and longitude.
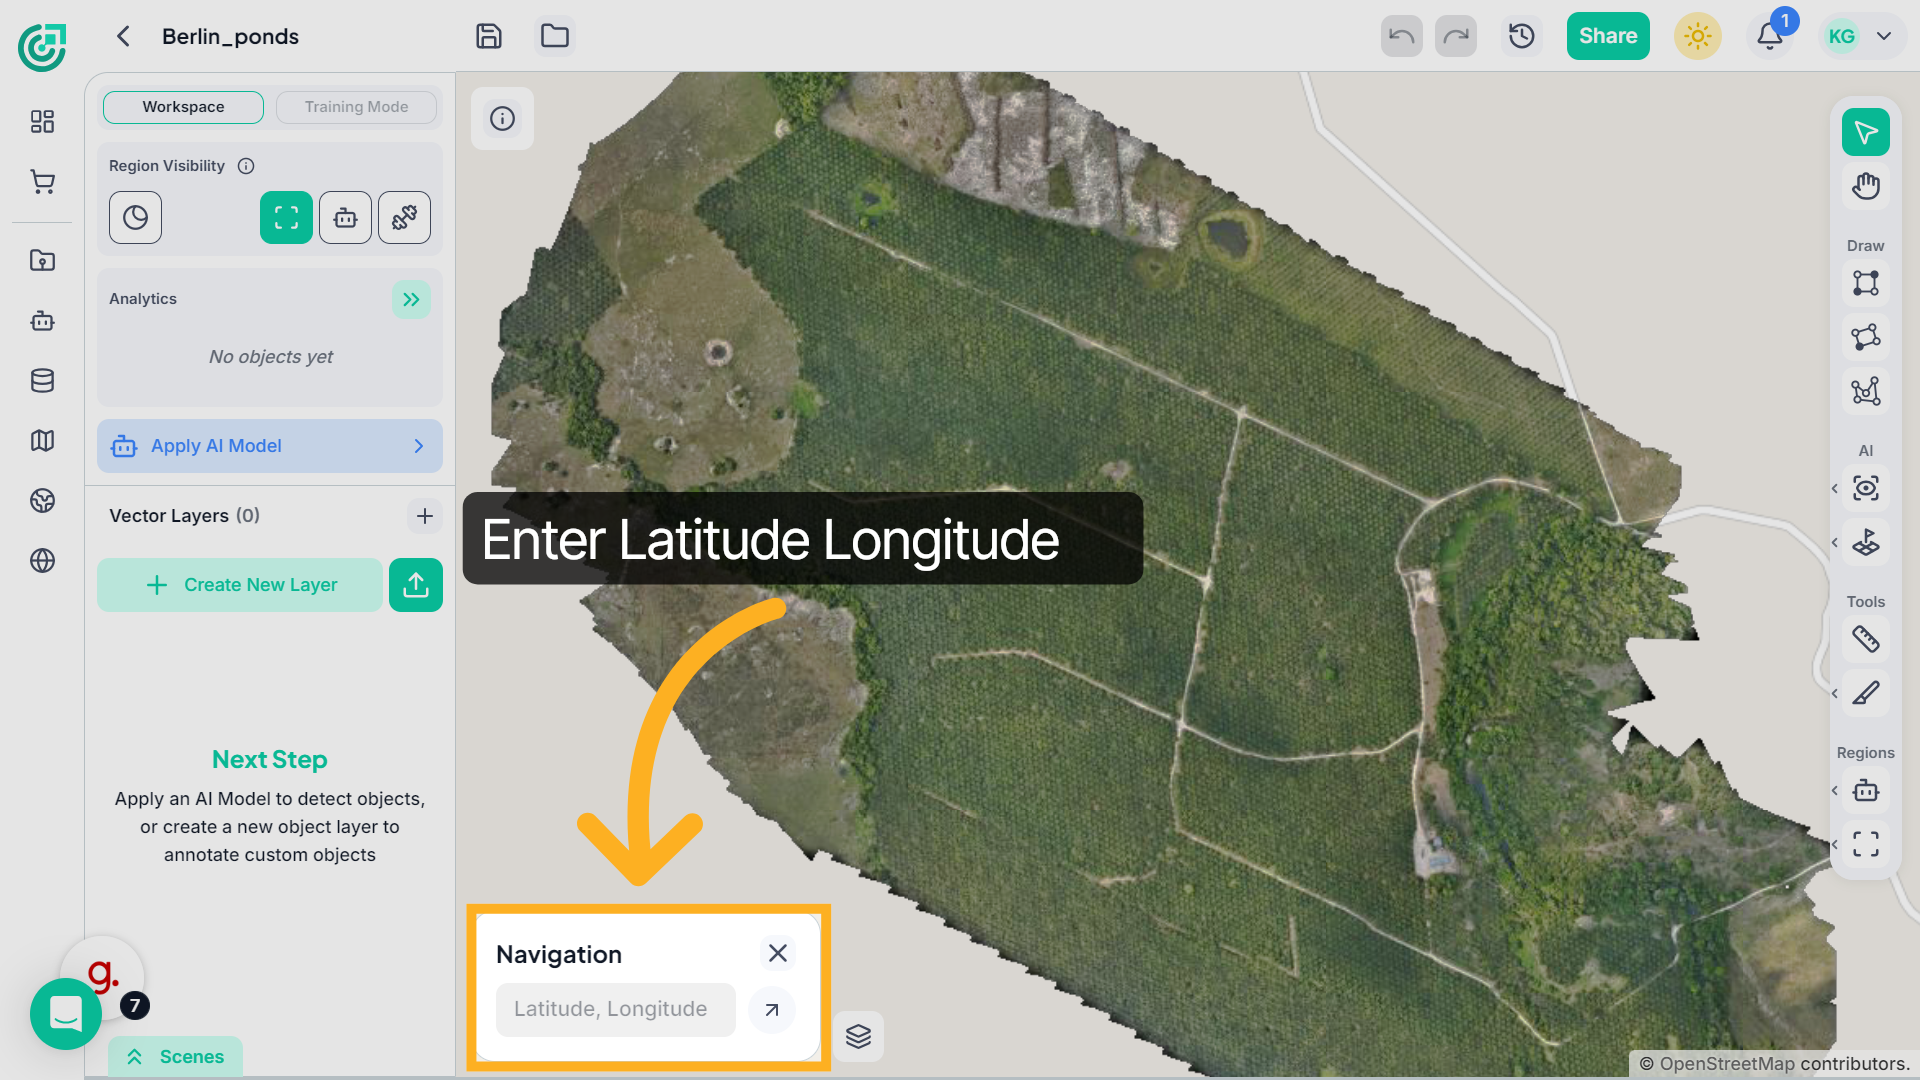
21. Access Navigation Settings
Enter the coordinates, and the map will instantly reposition. This is especially useful when working with large georeferenced datasets.
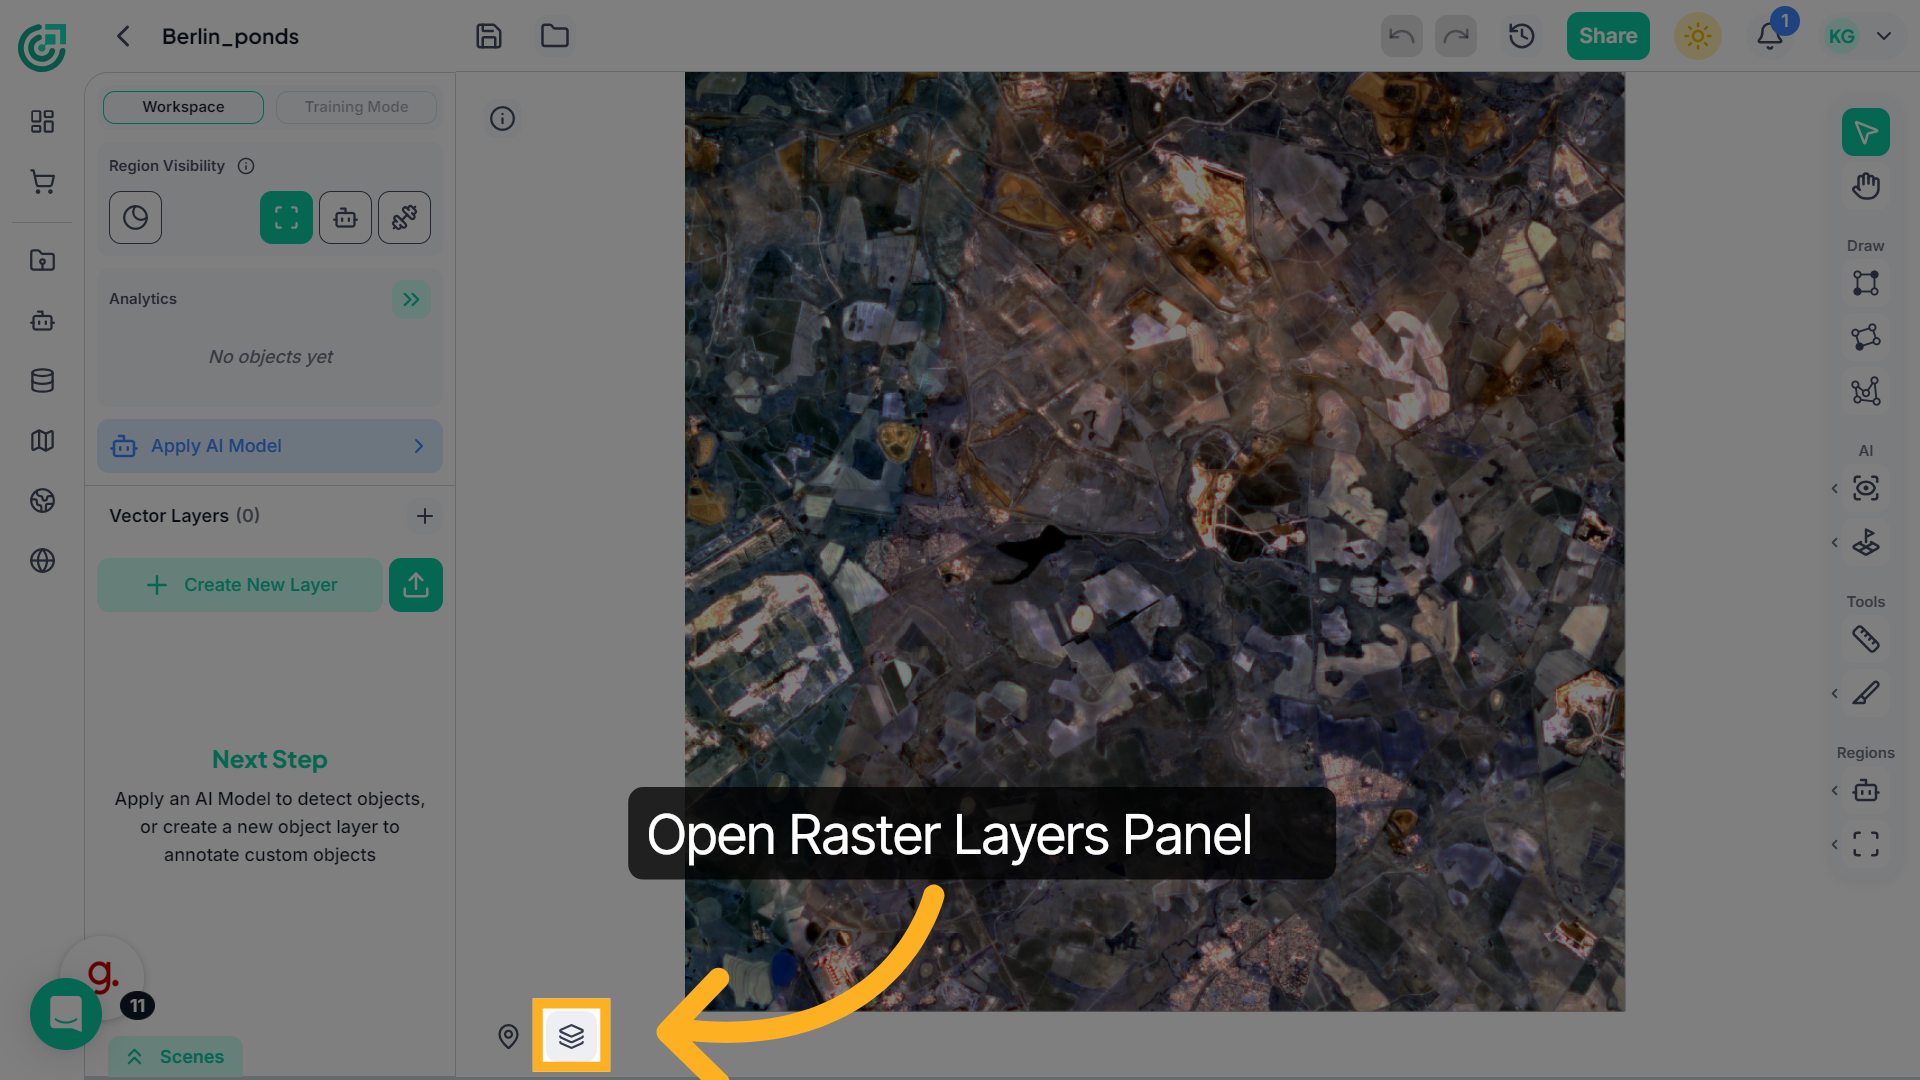
22. Raster Layers and Band Visualization
Open the Raster Layers panel to control how imagery is displayed.
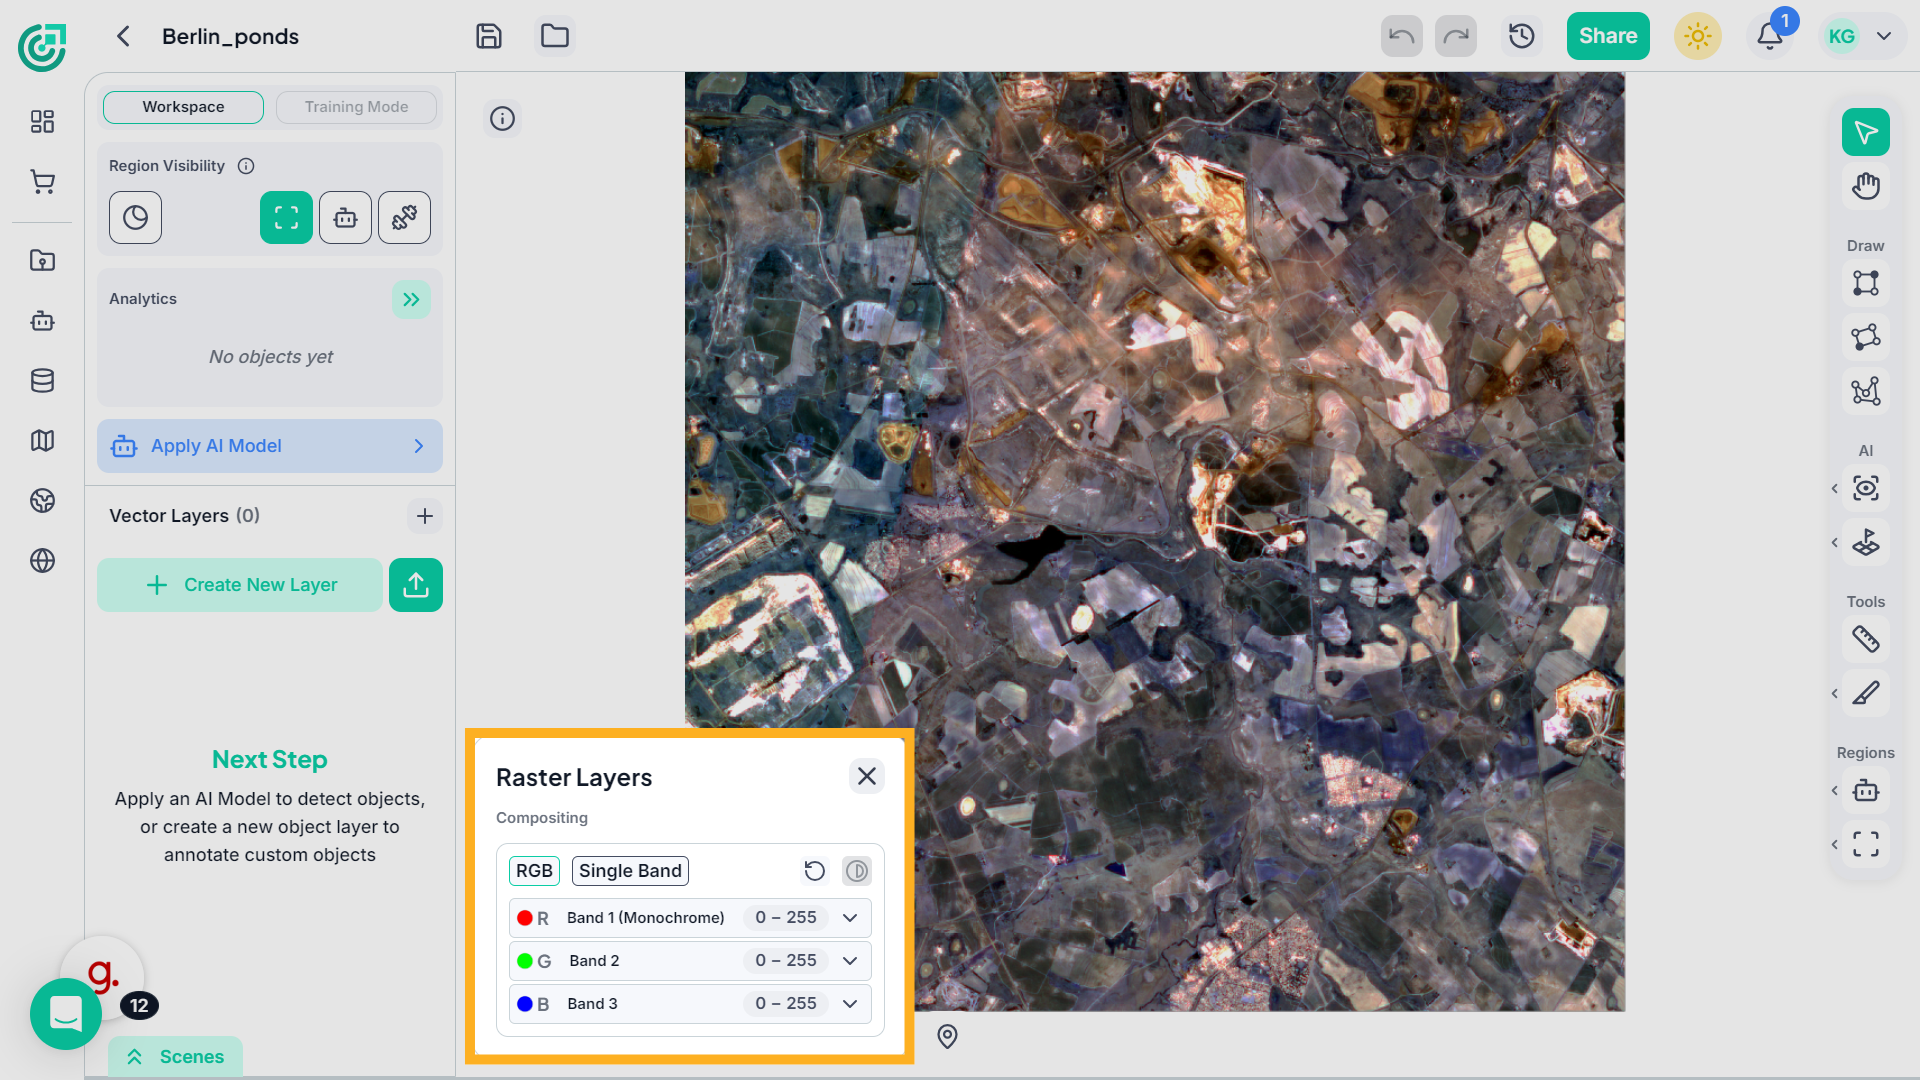
23. Access Additional Tools
Here, you can switch between RGB mode and Single Band mode depending on the type of imagery uploaded.
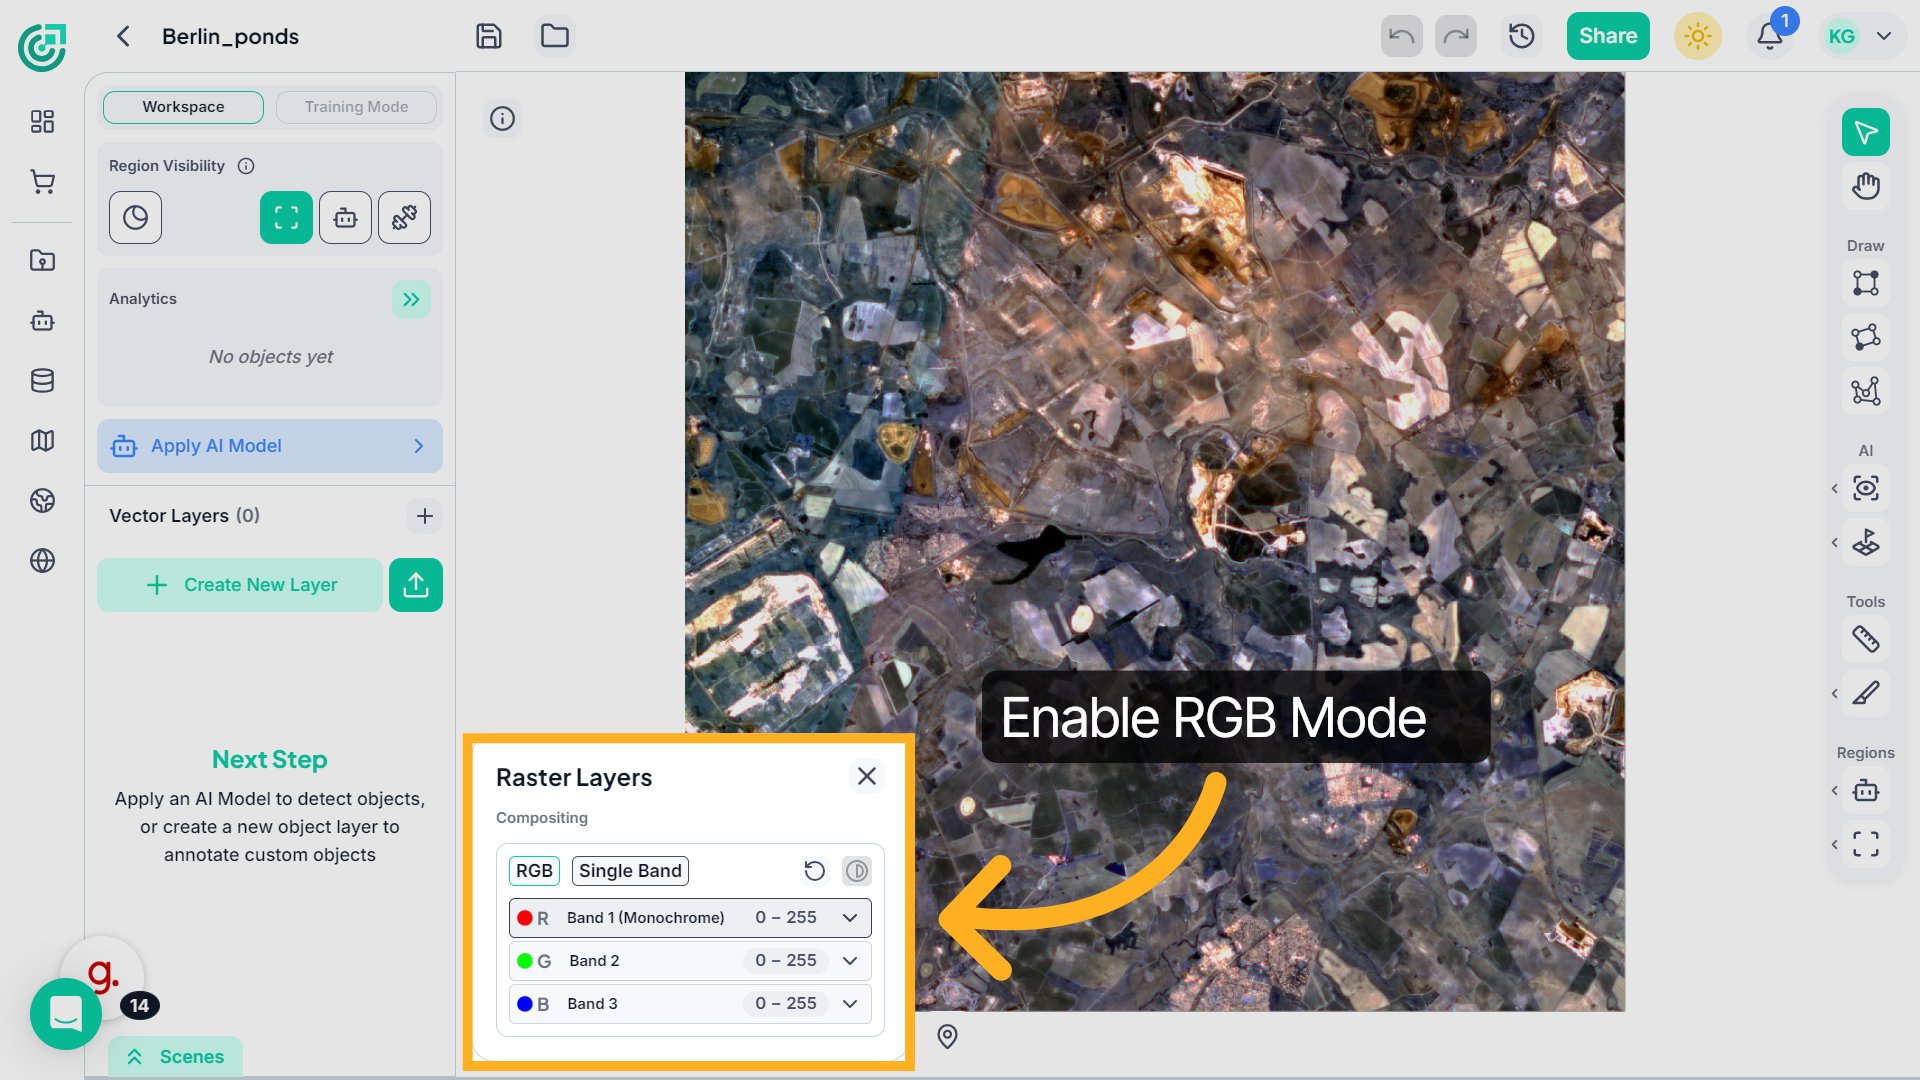
24. View Map Layers
Select RGB under Compositing to enable composite visualization. For each channel Red, Green, and Blue open the dropdown menu.
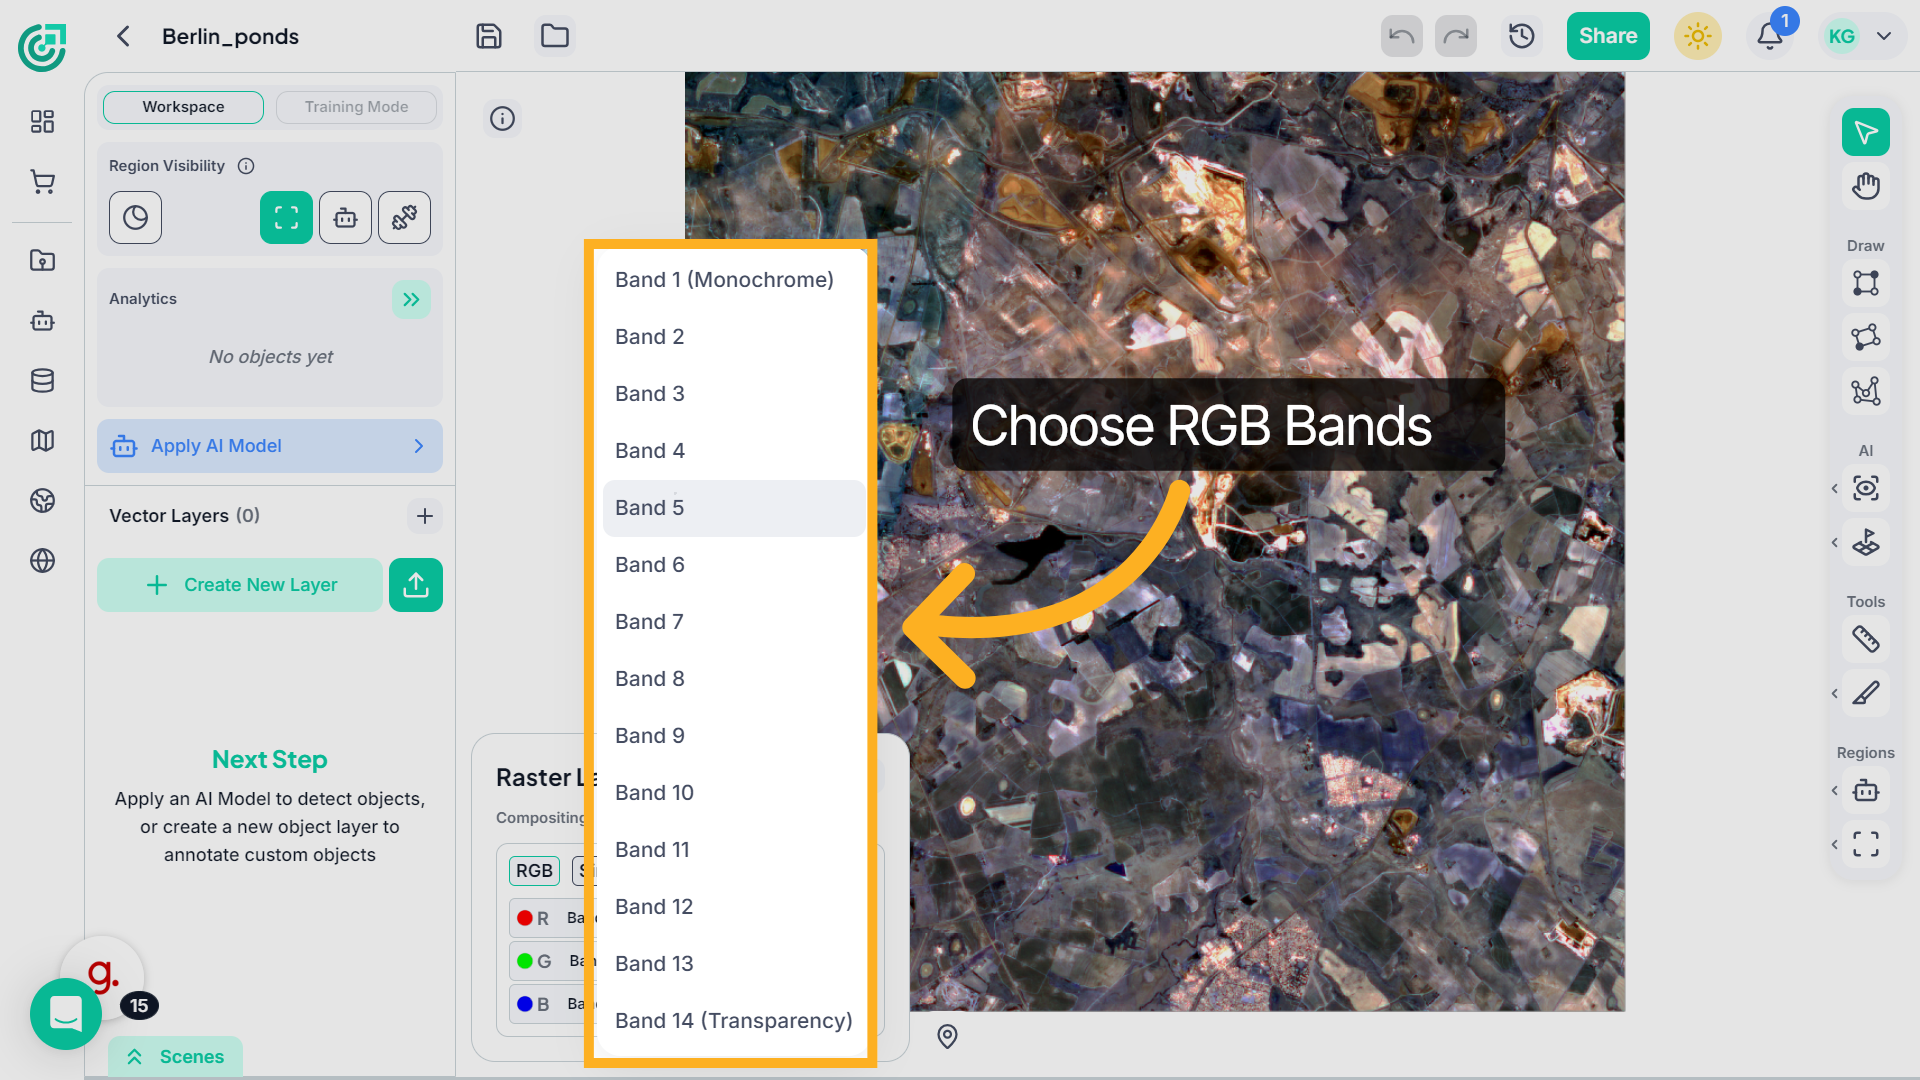
25. Choose Bands for RGB Channels
Select the band you want to assign to that channel. You can combine different spectral bands to create a customized composite image.
26. Image Update
The imagery updates automatically based on your selected bands
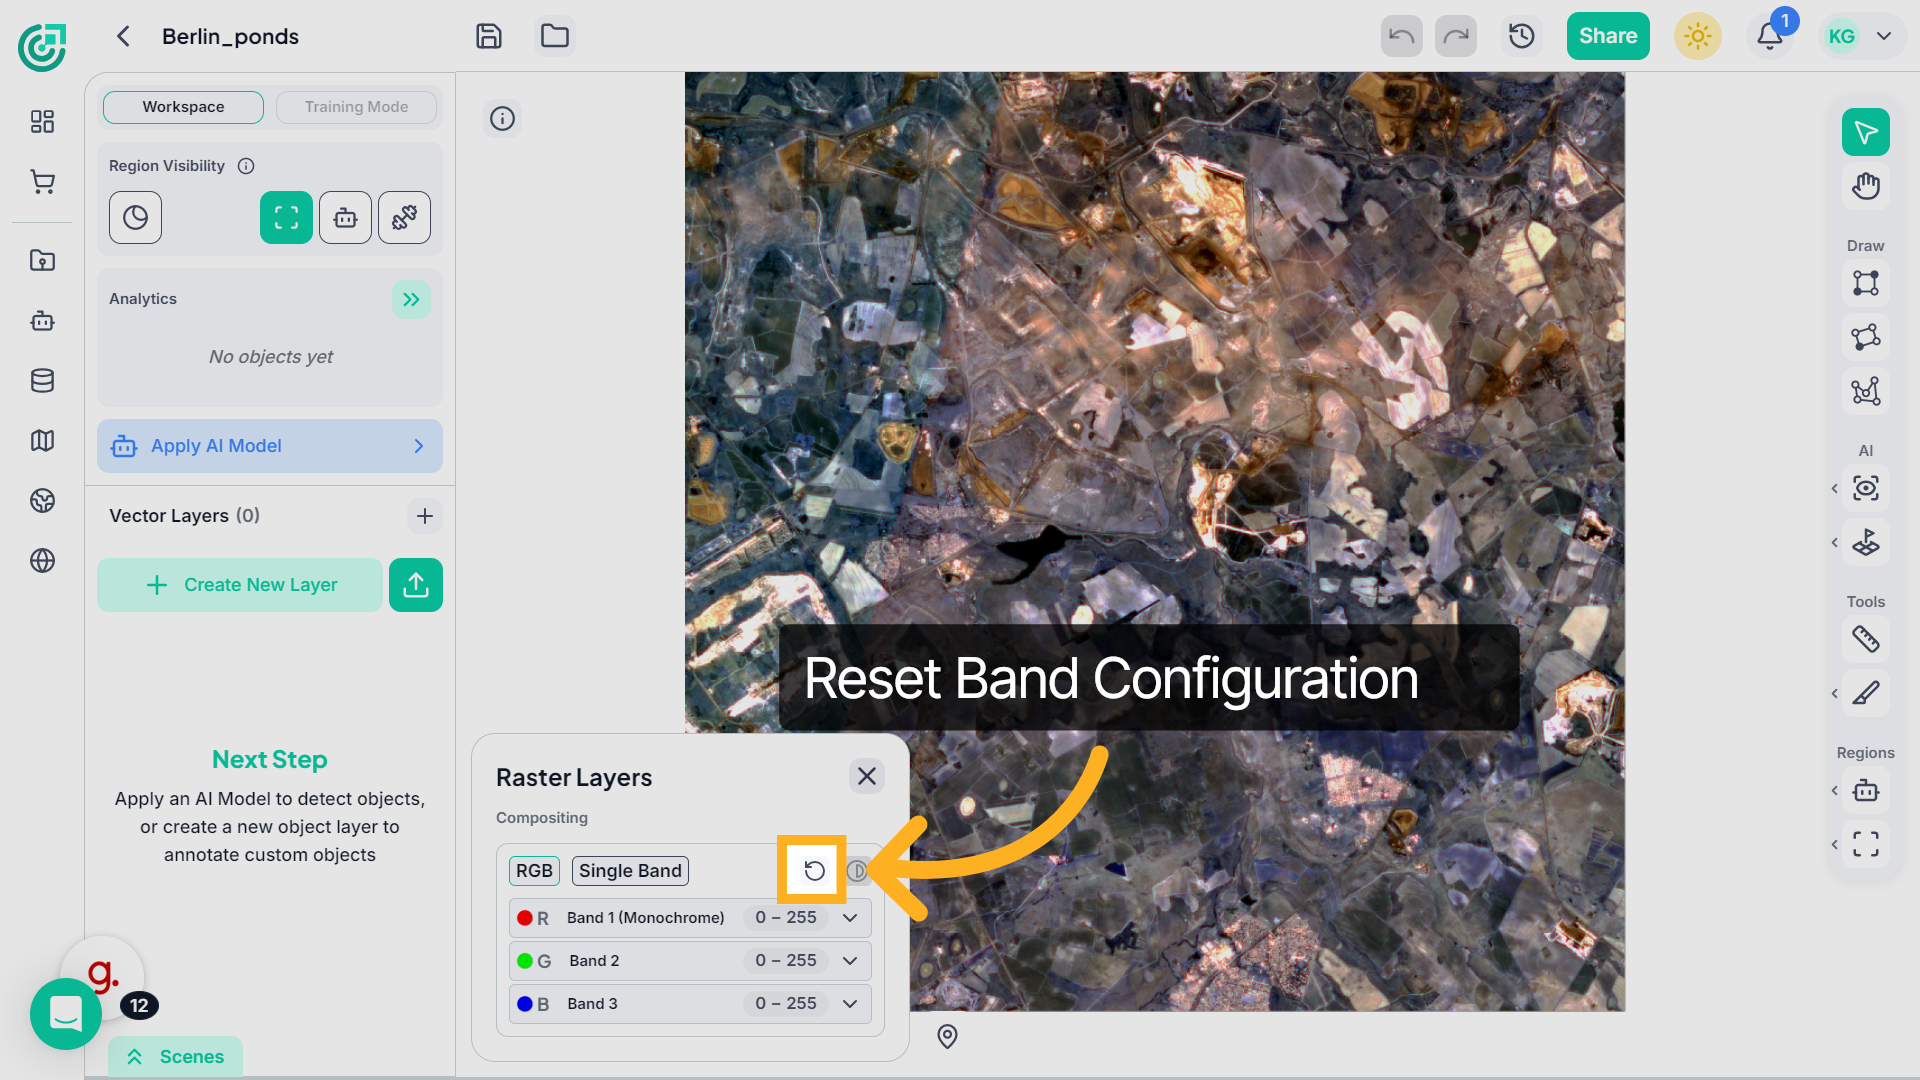
27. Reset Band Configuration
Click the Reset icon to restore the default band configuration.
28. Switch to Single Band
Now switch to Single Band mode from the Raster Layers panel.
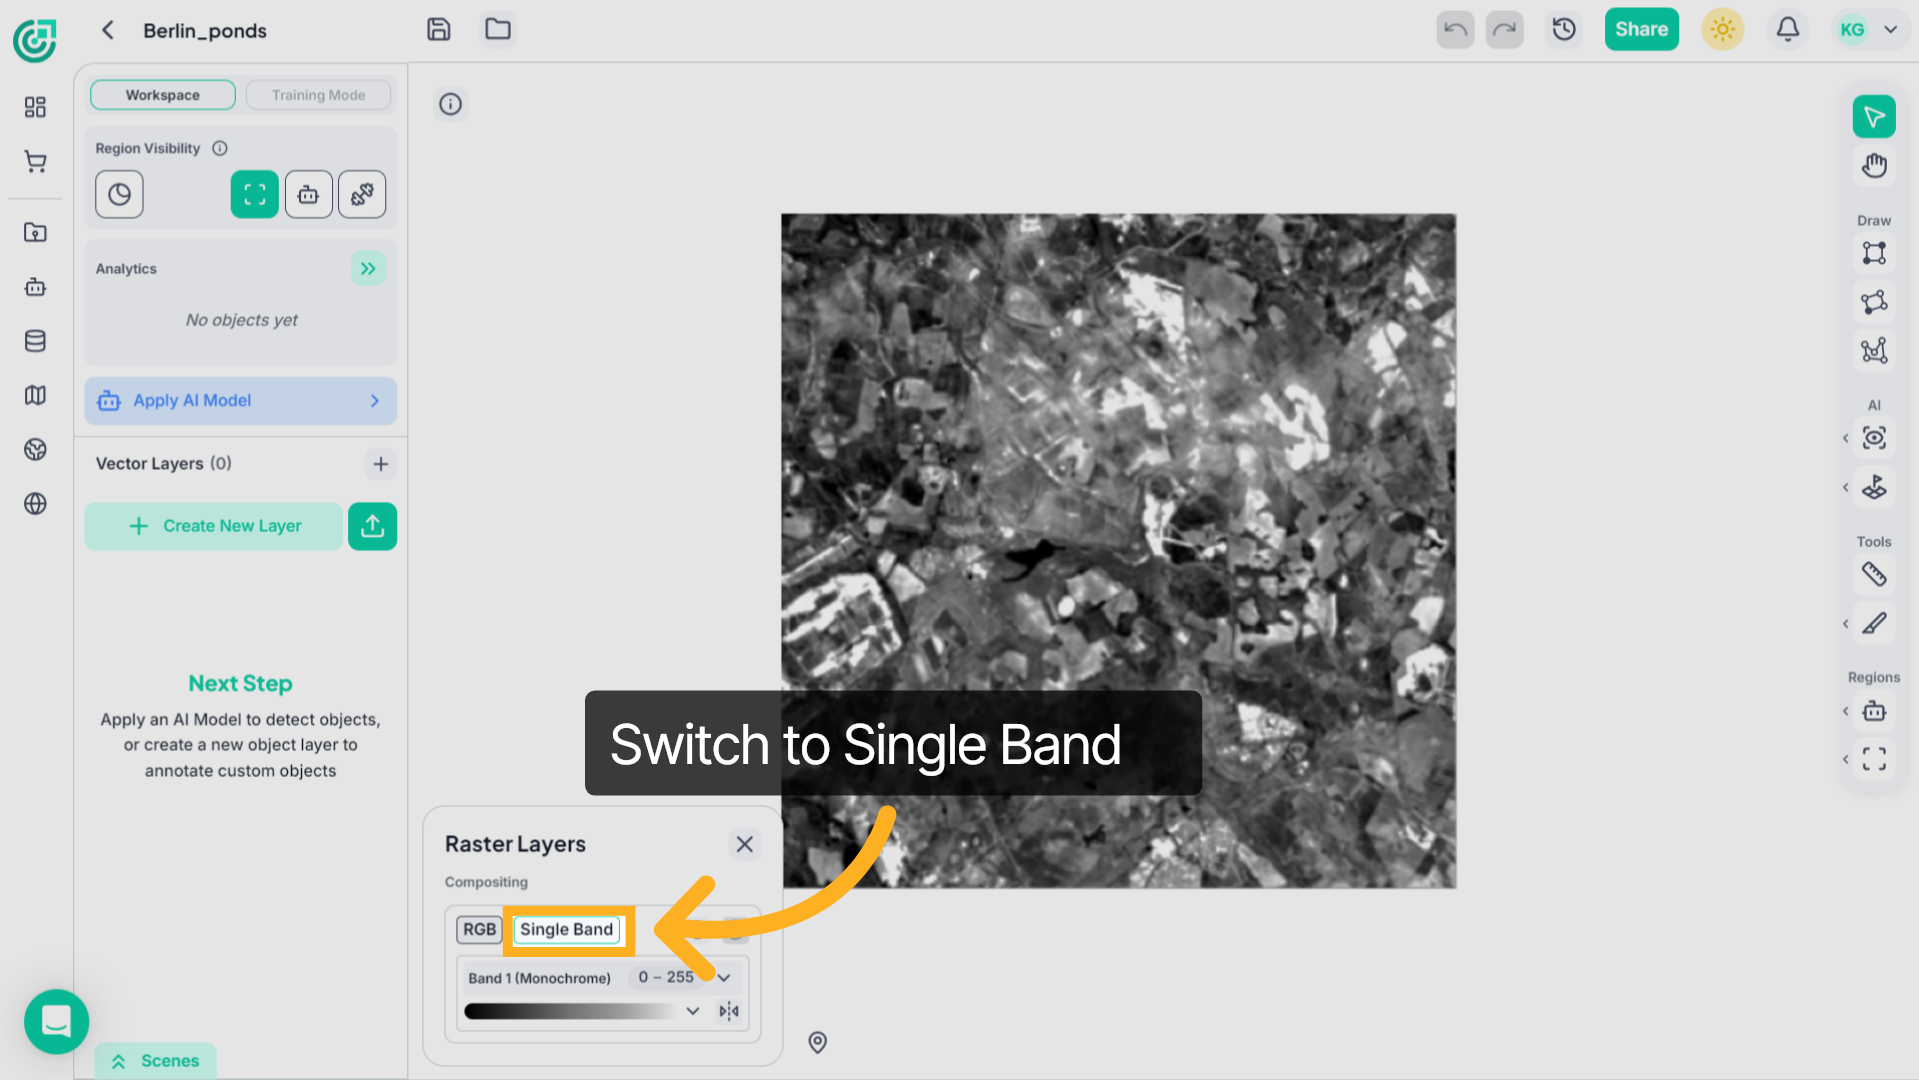
29. Single Band
Choose the band you want to analyze to view it individually for more detailed inspection.
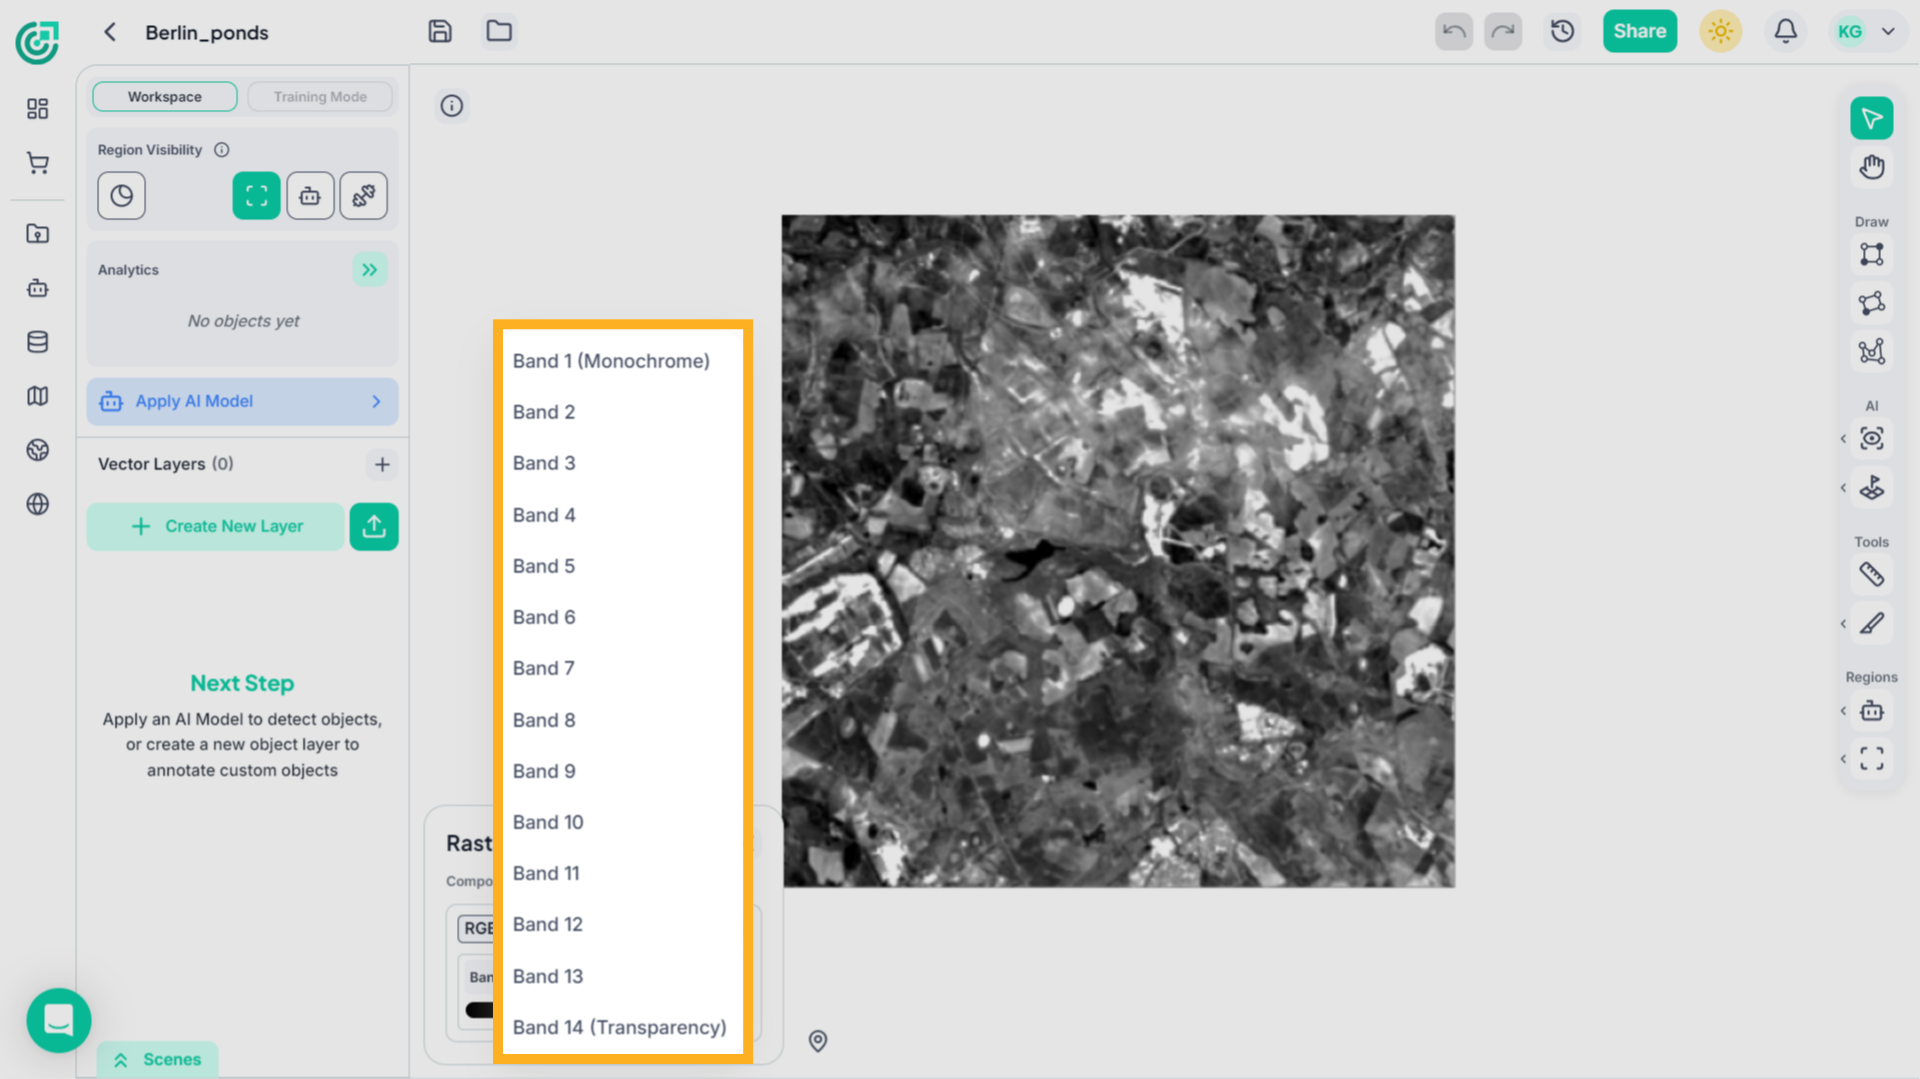
30. Single Band Mode
The imagery now displays the selected band in full view, allowing you to clearly examine its spectral details across the entire map.
You’ve now seen how to navigate the Map Workspace, reposition using coordinates, and customize raster visualization using both RGB and multispectral imagery. These tools allow accurate inspection and better decision-making when working with geospatial data in FlyPix AI.